LLM Cost Optimization Through Observability Data
Trace-level attribution reveals hidden cost drivers aggregate dashboards can't see.
A team watching its monthly token bill climb has no way to point at the line item responsible. The dashboard says spend is up substantially month over month, and every engineer in the room has a theory, but nobody can name the component actually driving the increase. That blind spot is structural. A production LLM deployment from 2024 might have run on one prompt and one model, a single cost surface that aggregate metrics could describe well enough. A production agent running today looks nothing like that: many prompts, multiple model IDs, several retrievers, a long list of tools, and a planner coordinating all of it, each one an independent place where tokens get spent and money leaves the building.
Aggregate token spend answers one question: how much did this cost in total. It cannot say whether the money went to the retriever's reranking pass, a retry loop that fired forty times before giving up, or a planner prompt bloated with few-shot examples nobody has trimmed in months. The component responsible for a cost spike is often several steps removed in the call graph from the component a team happens to be watching, so the dashboard and the actual cause rarely point at each other.
Traditional monitoring makes the problem worse rather than better, because it wasn't built to look at what agents do. Uptime, latency, and error rate are the metrics that have always mattered for services, and they still matter. But none of them catch a silent quality regression: a prompt that drifted from its tested version, or an evaluation score that quietly dropped while every health check stayed green. LLM observability has to track hallucinations, prompt quality, output relevance, and token cost directly, because standard infrastructure metrics have no vocabulary for any of those failures. A standard APM tool watching an agent in production cannot see a tool call fail on a malformed argument, cannot see a context window silently truncate a document the agent needed, and cannot see a loop retry the same broken step repeatedly. That requires instrumentation built for what an agent actually does, and the gap is a mismatch between what general-purpose monitoring was designed to measure and what an agentic system produces.
Trace Trees Expose Cost at Its Origin
The instrument that resolves this gap is the trace tree. Every LLM call, every tool invocation, every retrieval step, and every guardrail decision emits an OpenTelemetry span, and each of those spans can carry its own cost field. Summing those fields up through parent spans makes cost visible at every node in the tree, including the root. A billing dashboard shows one number for the whole request. A trace tree shows the cost of each step inside that request, laid out the way the agent actually executed it.
Breaking the trace apart reveals the difference immediately. A request that looked like an ordinary LLM cost problem might reveal, once the trace is broken apart, that the majority of the spend sat in the retriever's reranker step rather than in the model call everyone assumed was expensive. An aggregate dashboard never shows that fact, because it has no concept of a reranker step; it only has a total.
Distributed tracing that wraps LLM calls, tool invocations, retrievals, and the agent's internal reasoning steps is the foundation this whole approach rests on. Without spans at each of those points, there is no way to reconstruct what the agent actually did across a multi-step task after the fact. Practitioners building this instrumentation favor OpenTelemetry SDKs over manual monkey-patching or hand-built mocks, because an agent codebase changes shape constantly, and only a standard, maintained SDK keeps up with that change reliably enough to reconstruct streaming traces months later. A complete cost observability stack built on this foundation connects individual API calls back to the teams, features, and workflows that generated them, working at the level of the individual request rather than the level of the monthly bill. That shift, from billing aggregate to request-level attribution, is what turns a trace tree from an interesting diagnostic artifact into the basis of an actual engineering practice.
The three failure patterns that hide cost until trace-level attribution exposes them
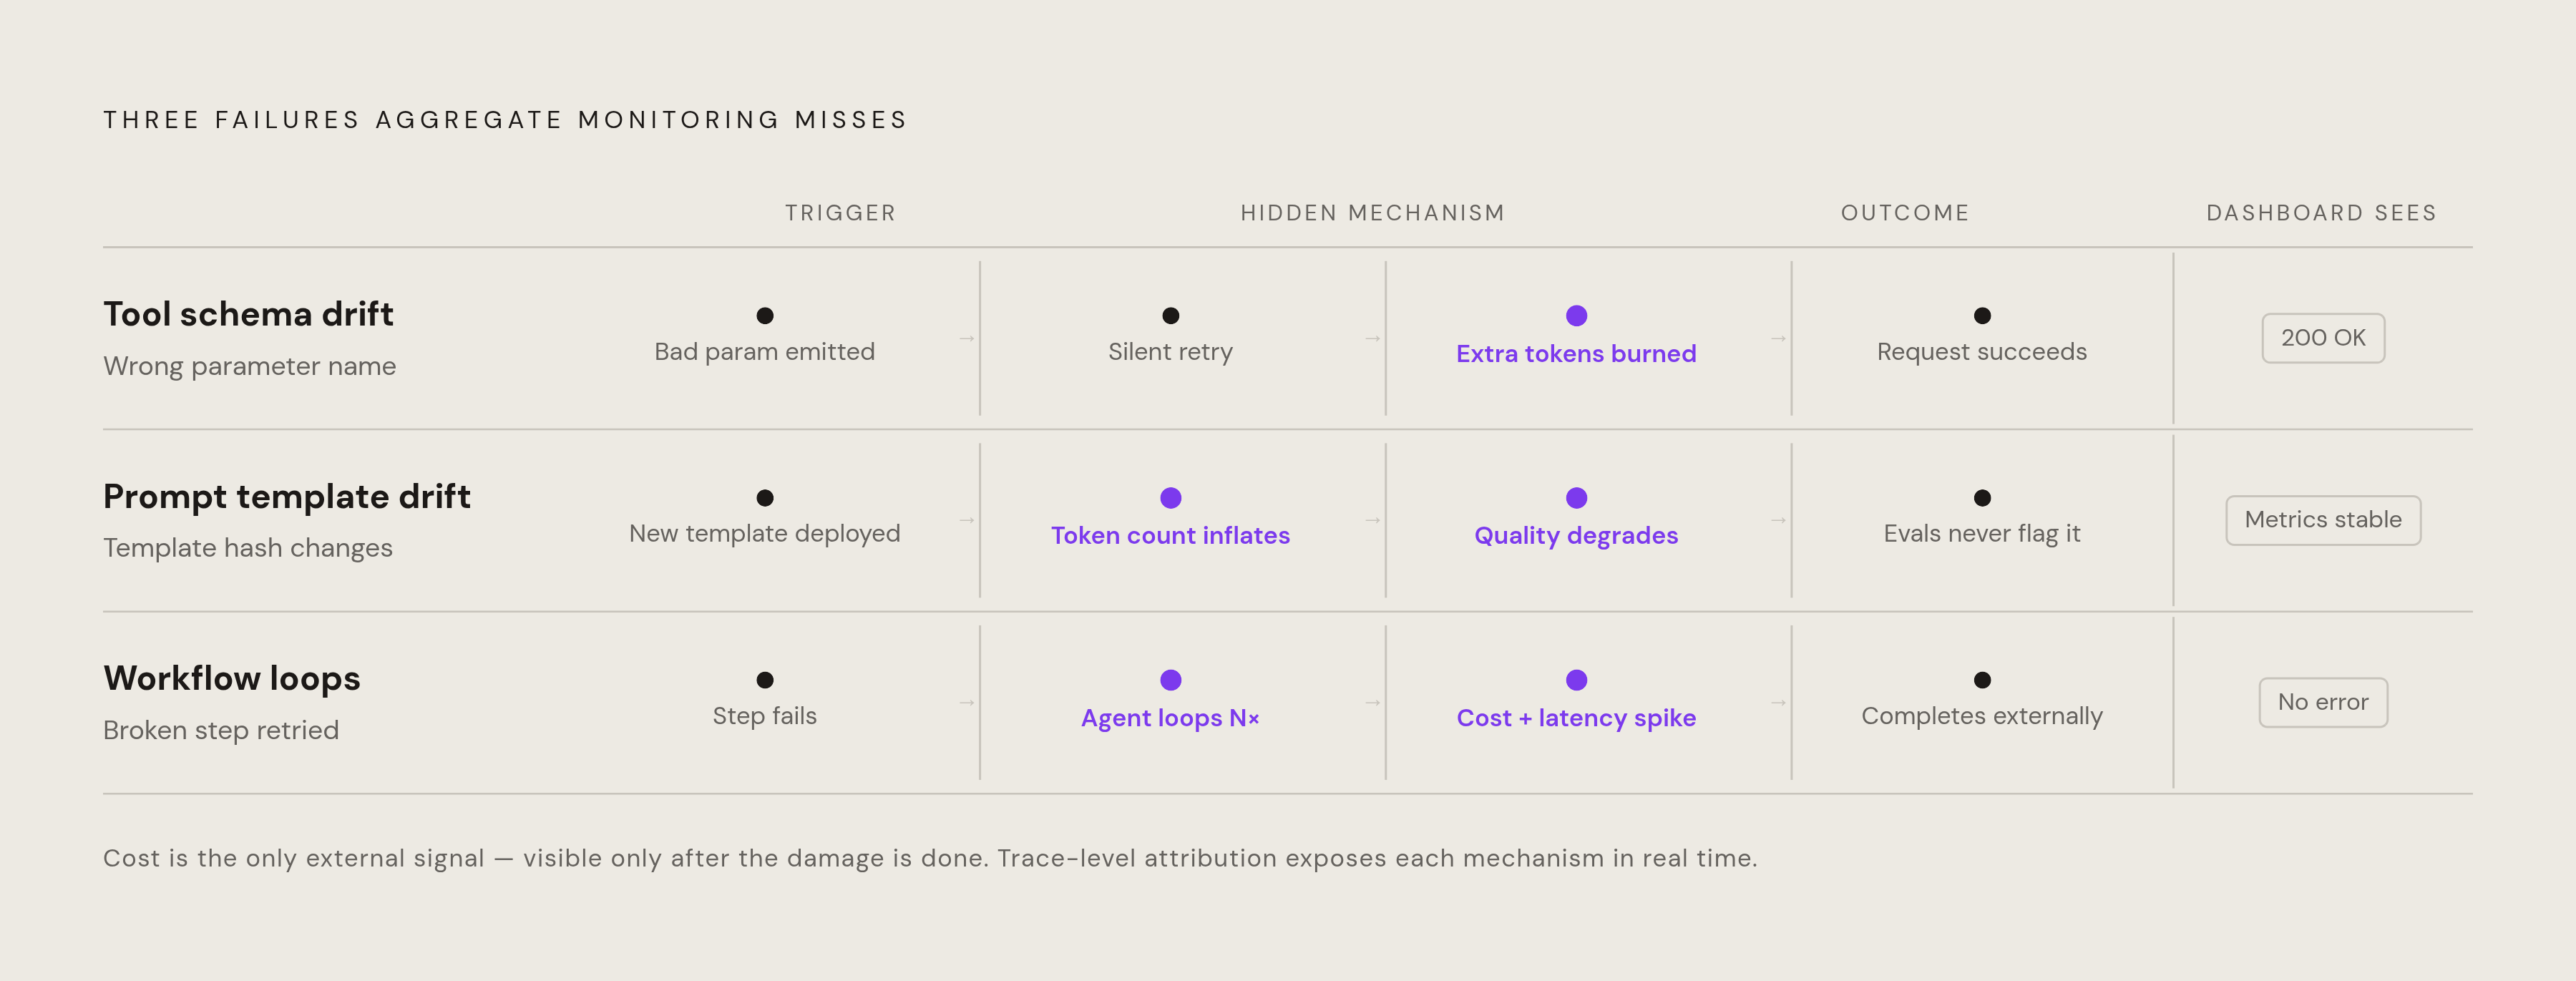
Three failure patterns account for most of the cost that aggregate monitoring misses, and all three are invisible until someone looks at the span level.
Tool schema drift is the first. A tool expects a parameter under one name, and the model emits a different one. The model often recovers after the tool returns an error, so the request still succeeds and the response still looks fine from the outside. But that recovery costs an extra round trip, and the retry burns tokens nobody budgeted for. Tools that were implemented correctly can fail later as the APIs they call, the data formats they expect, or the workflows surrounding them change out from under them, with no code change to the tool. Span-level attribution shows the retry and the malformed argument that triggered it. An aggregate metric shows only that one particular call cost a little more than expected, with no way to say why.
Prompt template drift is the second, and it's easy to miss because evaluation looks fine on paper. A golden evaluation set is a curated collection of inputs, but the model never sees those inputs raw. It sees them wrapped in a system message, folded into a few-shot block, and bundled with a tool schema, and that wrapper, the template contract, is a different object from the dataset itself. When the template changes, often as a well-intentioned tweak to formatting or instructions, it can silently inflate token counts and degrade output quality at the same time, and the evaluation set alone will never catch it. Catching it requires hashing the full template contract and re-baselining evaluation every time that hash changes.
Workflow loops are the third, and the most expensive when they happen. Some agents make a large number of LLM calls to answer a single user query, retrying the same broken step over and over before finally giving up, which drives cost and latency up together. The errors behind these loops take several forms: an HTTP response that returns successfully but contains hallucinated content, a tool call with a malformed argument the model never notices, or a step the agent simply retries far more times than it should. The request still completes from the outside, so none of that appears as an error in a traditional sense. The elevated total cost gives the only hint that something went wrong, and that total appears on a dashboard only after the loop has already run its course.
Root-Cause Attribution by Responsible Layer
Knowing that a run failed and cost more than it should have is close to useless on its own. What a team needs is the specific layer responsible, whether that's the prompt, the tool, the workflow logic, the memory system, the model, or the product logic wrapping all of it, because each of those layers calls for a different fix. A fault traced to the harness calls for harness redesign. A fault traced to a tool schema calls for schema validation at the point of the call. A fault traced to a workflow loop calls for a retry policy that breaks the loop before it compounds. Mixing these up wastes engineering time on the wrong layer.
Without that layer-level attribution, teams tend to reach for the most visible lever available, which is usually swapping the model. That's rarely the right fix, and it's the most expensive one to test, since a model swap means re-running evaluation, re-checking quality, and re-validating cost across the whole system before anyone knows if it helped. The step where an error becomes visible is frequently not the step that caused it. The diagnostic evidence tying the two together is often sparse, scattered across actions that happened well before the visible failure, and disconnected from it in the call graph.
Diagnostic methods that rely on a single LLM judgment over an execution trace work reasonably well on short trajectories, but they tend to settle on a plausible-looking diagnosis early and leave evidence in longer traces unexamined. A 2026 paper introducing a method called Continual Search (arXiv:2609.13463) addresses this directly: as execution logs get larger, an iterative framework that keeps pushing the judge to examine evidence it hasn't yet looked at outperforms a single pass over the same trace. The AgentDebugX toolkit (arXiv:2607.18754) puts this into practice with a component called DeepDebug, a multi-turn root-cause diagnostic agent built for exactly the cases a single trace reading can't resolve. It produces an auditable report naming the responsible step, the supporting evidence, an explanation, and a concrete fix.
This granularity is what makes the attribution usable rather than merely descriptive. Pointing at "the retrieval step" as the source of a cost spike still leaves open whether the problem is the number of retrieval calls, the token cost of the reranker, or a schema mismatch triggering retries further down the chain. The span hierarchy resolves that ambiguity, because each layer carries its own cost field, and the attribution is only as fine-grained as the instrumentation underneath it.
How harness changes reduce cost without touching the model
Once a trace attributes cost to a specific layer of the harness, the fix almost never involves retraining the model. It involves a targeted change to a prompt, a tool schema, a retrieval strategy, or a retry policy, while the model's weights stay exactly where they are. That's a meaningfully smaller intervention, and it's reviewable and reversible in a way a model swap isn't.
The LIFE-HARNESS paper (arXiv:2605.22166) gives this idea a concrete structure, splitting the harness into four layers that can each be changed independently: environment contracts, procedural skills, action realization, and trajectory regulation. Changing one of these doesn't require rewriting the rest of the scaffold around it. The paper's ablation results show why that structure matters: removing the trajectory memory layer alone caused a dramatic drop in performance on the ALFWorld benchmark, which demonstrates that these harness layers are doing real work rather than sitting there as cosmetic scaffolding. Performance across evolution rounds improves steadily and eventually levels off, and that pattern reflects what localized updates deliver: each change targets an identified failure mode directly, instead of a blanket adjustment applied to the whole system at once.
The harness is also the right place to enforce cost discipline directly. A retry policy that caps the number of calls a step can make before failing loudly stops a runaway loop from compounding its own cost quietly in the background. Validating a tool schema on every call, checking required fields and logging malformed arguments straight into the trace, catches schema drift before the model racks up a retry. Structured answer-extraction layers and parsers that feed error details back to the model as context cut down the number of follow-up calls the model needs to make to recover from its own mistake.
Validating harness changes against production traces before shipping
A harness change that looks right in isolation can still behave unpredictably once it meets the actual distribution of inputs that caused the original failure. Trace replay is what closes that gap before a fix ships. A saved trace tree can be replayed in pre-production using the same prompt versions, the same tool stubs, and the same judge model that produced the original run, and the unit being validated is the tree as a whole, not any single call pulled out of it.
Traditional log-based debugging doesn't hold up here, because non-deterministic systems need exact reproduction of the call sequence and every tool invocation inside it to diagnose a failure with any confidence. Model updates, prompt edits, and tool schema changes all introduce drift silently, so drift itself has to be treated as a signal worth validating against, and the most reliable early warning comes from scheduled replay of a fixed, golden set of traces against whatever is currently running in production.
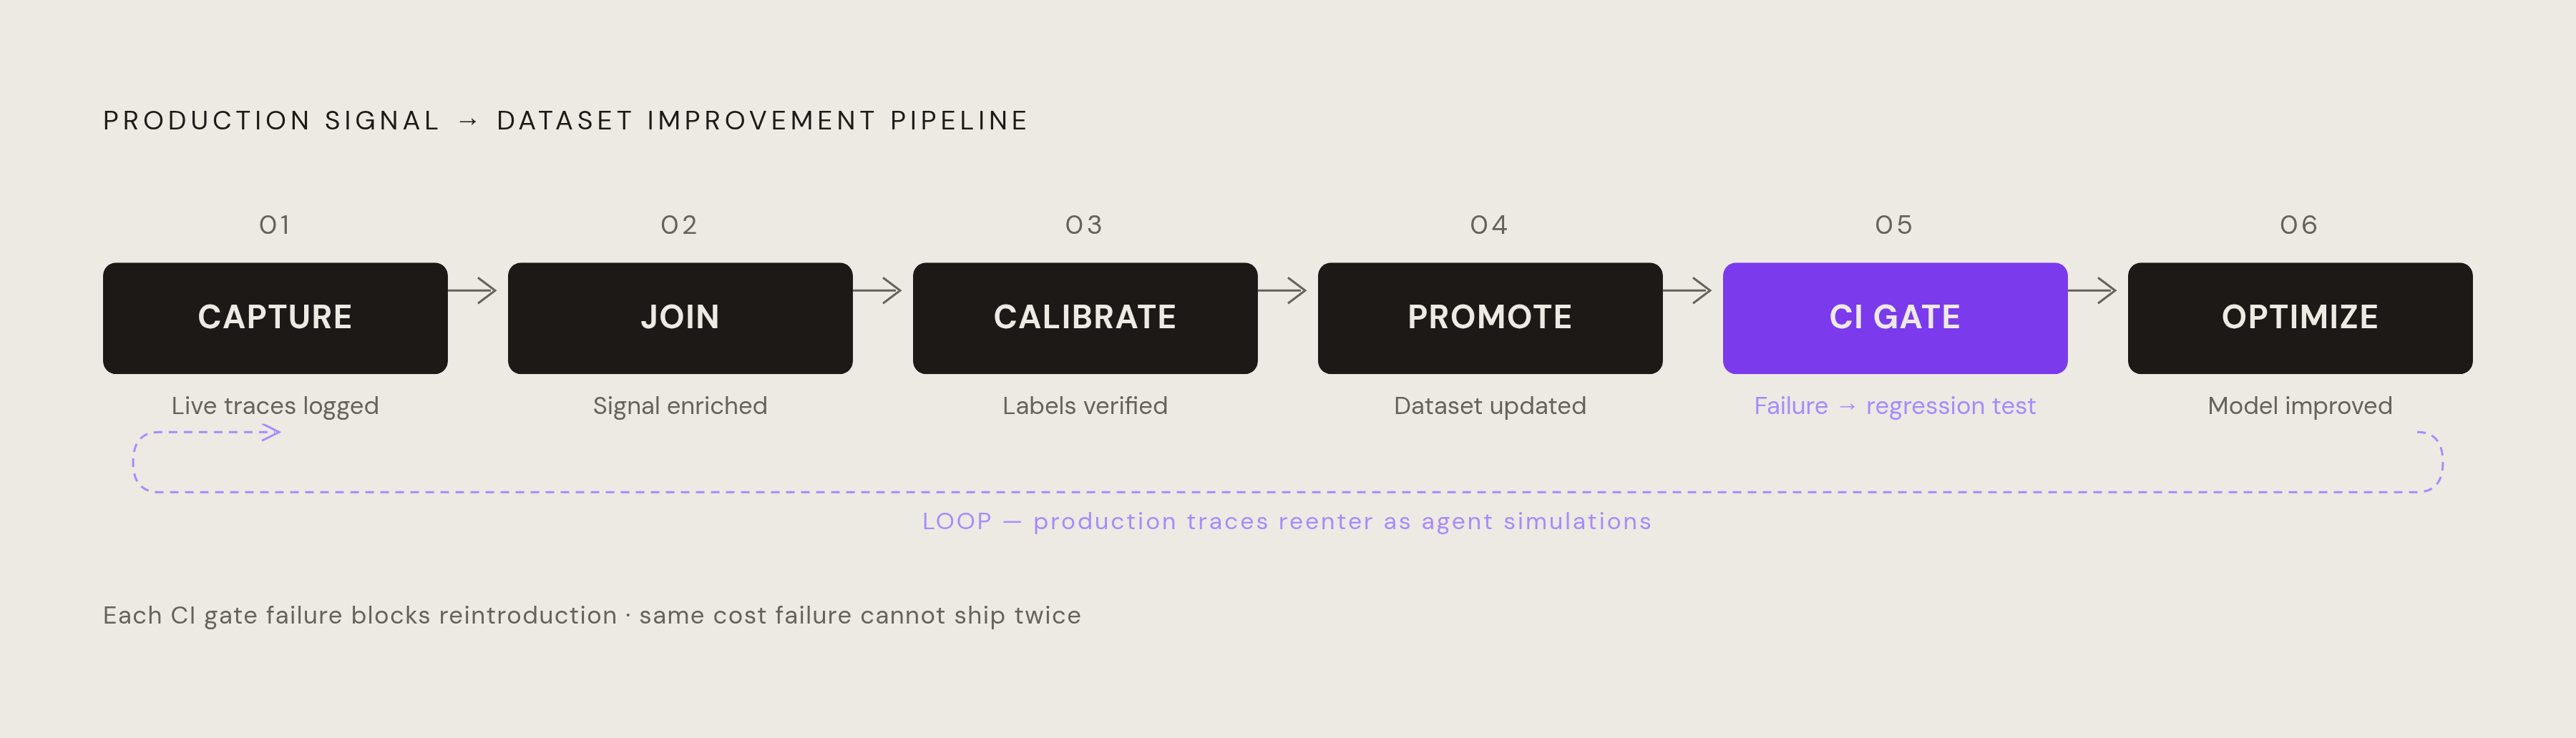
The CI gate is the mechanism that keeps a fixed cost failure from shipping a second time. Production traces get converted into agent simulations and regression tests, so a failure observed once in the wild becomes a repeatable test that blocks the same failure from being reintroduced later. That fits into a six-stage feedback loop, capture, join, calibrate, promote, CI gate, optimize, which turns live production signal into concrete dataset improvements, with the CI gate as the step that actually closes the loop. The same infrastructure that surfaces a cost failure in the first place can run prompt variants against real production traffic and compare them directly, without a separate experimentation system bolted on.
None of this scales if every trace from every request gets stored and replayed in full. Tail-based sampling makes the practice tractable at volume: keep every error, every trace with a below-threshold evaluation score, every high-cost trace above a defined percentile, and a small, steady fraction of clean traces to track overall trends. That keeps the replay corpus focused on the traces most likely to expose a regression, whether that's a cost spike, a quality failure, or a loop pattern, without paying the storage cost of keeping every span from every request indefinitely.
Treating cost optimization as a continuous engineering discipline, not a one-time audit
Cost optimization for an agentic system is a feedback loop that deserves the same rigor as code review or test coverage, because every layer of the harness is a surface where drift can quietly reappear months after the original fix shipped.
Advances in deployed AI systems increasingly come from the co-evolution of foundation models and the harnesses wrapped around them, rather than from improvements to foundation models on their own. Stronger harnesses produce higher-quality execution traces, and those traces feed back into further improvements to the system over time. That co-evolution depends on a recursive loop: for a given foundation model, a stronger harness organizes more effective agent workflows, and the signal for what to improve next lives in the production traces the system is already generating, not in a synthetic benchmark built in advance.
The organizational implication follows directly from that. Cost attribution, harness iteration, and trace replay cannot sit with one engineer running an occasional audit between other priorities. They need to be built into the same release process that governs every other change to the system, so that the trace data generated by production traffic becomes the standing record against which every new harness change gets measured, repeatedly, for as long as the system stays in production.