Cost, Latency, and Quality Alerting on Production Agent Traces
Detect silent failures in LLM agents that traditional infrastructure monitoring cannot see.
At 2am, the dashboards are green. CPU is nominal, error rate is flat, p99 is comfortably inside its threshold. And yet users are getting incoherent answers, the monthly bill has tripled since last week, and a chunk of requests are hanging for thirty seconds before anything comes back. No alert fires, because nothing built to monitor infrastructure was designed to notice that an LLM agent can be up, fast on average, and still wrong.
That gap is the subject here. Cost, latency, and quality are three separate failure signals in production agent systems, and each one catches a class of breakdown the other two cannot see. Monitor only two of them, and the third kind of failure runs invisibly until a customer complains or a finance team asks why the AWS bill doubled.
What trace-level data actually contains and why span granularity is the prerequisite
Classical observability answers two questions: is the service up, and how fast is it responding? Neither question touches whether an LLM's output is any good. A model can return a 200 status code, valid JSON, and a confidently wrong answer, and every log line will look healthy. So the data model itself has to change before any of the three signals, cost, latency, or quality, can be measured honestly.
Trace-level data works at three units of analysis, and each covers a different scope of the problem. A span is the smallest unit: one model call or one tool call, carrying its prompt, its response, model parameters, token counts, computed cost, finish reason, and any error. A trace assembles the spans from one complete agent run, planner decisions, tool invocations, retrievals, retries, handoffs, stitched together across process boundaries using W3C context propagation. A session goes one level higher still, grouping traces by session ID so cost and quality get rolled up across an entire conversation. This matters because a failure buried in turn five of a six-turn thread is invisible if the only unit you track is the individual API call.
Span granularity is not a nice-to-have. Consider a support-agent trace running 8.42 seconds across 14 spans, cited in an OpenObserve trace example: 41% of that elapsed time turned out to be a Postgres lock wait, not the model doing anything at all. That fact appears only when the LLM span and the infrastructure span live in the same trace, in the same store, under the same trace ID. Split them across separate tools, an LLM observability platform here, an APM tool there, and the lock wait disappears into a seam between two dashboards that never talk to each other.
The OpenTelemetry GenAI Semantic Conventions give the ecosystem a shared vocabulary of model names, token counts, finish reasons, all defined in a vendor-neutral schema. As of 2026 the conventions remain in Development status rather than formally Stable, with coverage still expanding, but the core span attributes are stable enough in shape that teams are building production tooling on top of them already. That standardization matters more in agent systems than in single-call LLM apps, because a missing span cannot be reconstructed after the fact. LLM behavior is not deterministic across retries: the same user question might take a different retrieval path or land on a different answer the second time around, so there is no replaying your way back to what actually happened if the span was never captured.
Multi-agent architectures multiply this problem. Planners, routers, tools, and sub-agents each carry their own prompts and often their own model versions, and one small prompt edit in a sub-agent can break the flow several steps downstream. Teams need to see which configuration changed and which component the regression traces back to, and that only works if evaluation itself can operate at span, trace, or session scope, because the scope you choose determines which failure class you can actually see.
Cost signals: what token-level attribution catches that invoice-level billing never will
Cost in agent systems is an engineering signal first and a finance line item second. A single unoptimized prompt chain, left unchecked, can multiply expenses by an order of magnitude, and without visibility into usage as it happens, teams typically find out about the overrun only after the invoice arrives and the damage is already sitting on the books.
The first fix is granularity. Every request burns through multiple distinct token categories, prompt inputs, tool invocations, memory, and generated responses, each contributing separately to overall spend. Roll all four into one generic input/output bucket, and spend becomes impossible to optimize, because you can no longer tell whether the bill went up because responses got longer or because a retrieval step started stuffing three times as much context into every call.
Pricing complexity compounds the problem. Different token types, inputs, outputs, cached tokens, and modality-specific usage, each carry their own price, often on their own schedule. Teams routing across OpenAI, Anthropic, AWS Bedrock, and Google Vertex simultaneously need a cost view that normalizes across pricing structures that were never designed to be compared. And attribution needs to run along three separate dimensions, per-user, per-feature, per-tenant, because each answers a different question: which account is driving cost, which feature is expensive to run, which customer segment is profitable at the price you're charging.
Alerting patterns published in Braintrust's 2026 material lay out three distinct controls, and the architecture behind each one is deliberate. A hard cap per user blocks or throttles an account once it crosses a configurable daily budget, most useful in free tiers and trials where a single account can otherwise drive disproportionate spend. That check belongs in the proxy or middleware layer, because by the time a single LLM call has already billed its input tokens, blocking it is too late to matter.
A soft alert per feature fires when the cost of a feature's requests drifts above a rolling baseline. Feature-level alerts are what catch prompt regressions, context bloat, and retry patterns early, because those changes shift the average cost of a request well before the aggregate provider invoice moves enough to draw anyone's attention.
A kill switch on agent runs stops execution outright once token count, tool-call count, retry count, or span depth crosses a ceiling defined for that agent type. That control has to live inside the agent framework itself, because a runaway loop needs to be interrupted while it is still running. An alert that fires after the run has already finished arrives too late to save the tokens it already spent.
Runaway cost, in practice, almost never traces back to the model misbehaving. It traces back to prompt bloat, retry loops, or tool-call chains spiraling. Cost is a harness-layer signal far more often than a model-layer one, and the alerting design should reflect that.
Latency signals: why tail percentiles and span-level timing expose different problems than averages
Averages flatter a system. Tail percentiles, P95 and P99, are what actually drive perceived slowness and timeouts in distributed systems, and controlling the tail matters just as much as bringing the average down, arguably more, since it's the tail that generates the support tickets.
LLM agents complicate tail-percentile reasoning further, because latency itself is non-deterministic in ways a traditional web service is not. Time to first token and total generation latency both vary with token count, model load, batching configuration, and KV-cache hit rate. The same model, given two structurally similar requests, might return one in under a second and the other in tens of seconds. That variance is a signal. It is the signal.
Latency has to be watched at three scopes at once: session, trace, and span, covering retrieval, tool calls, and inference separately. A slow trace can be entirely explained by a span that has nothing to do with the model at all, which is what the earlier 8.42-second support-agent trace showed: the "slow" label technically belongs to the trace, but the cause sat in a Postgres lock wait eating 41% of the total time, a fact no purpose-built LLM latency tool would ever surface if it doesn't carry infrastructure spans in the same trace.
Once latency attribution runs at the span level, the fix changes. A nine-second answer that looks, from the outside, like a slow model turns out in span-level analysis to be a slow downstream dependency, or a sub-agent that retried multiple times and burned the majority of the total time on retries alone. Neither pattern is visible at the trace-average level. Both are obvious once you look at spans.
Latency and cost are not two separate stories here so much as two views of the same one. A retry storm that inflates latency is, by definition, also inflating token spend, since every retry re-runs the call and re-bills the tokens. A latency alert on a retry-heavy span is functionally a cost alert too. The two signals reinforce each other rather than duplicating effort.
Quality signals: what cost and latency together still cannot catch
A trace can be cheap and fast and still be wrong. That's the asymmetry that makes quality the hardest signal to build and the easiest one to skip: cost and latency measure how the system ran, not whether what it produced was any good.
LLM failures rarely throw an exception. The pipeline runs start to finish, no error code fires, no latency spike occurs, no token anomaly appears on any dashboard. The output is simply wrong, or hallucinated, or in violation of a policy nobody flagged, and every other signal in the system says the request succeeded.
Quality measurement in agent systems has to operate above the level of scoring the final answer alone. At the trace level, the question is whether the full run actually completed its objective, resolved the conversation, followed policy, and held context across turns. At the step level, the useful metrics are tool selection accuracy, tool argument correctness, planning quality, and reasoning coherence, the kind of granular checks that show where a run started going wrong rather than just confirming that it did. At the conversation level, the concern is multi-turn context retention, since the failure so often occurs in turn five of a six-turn thread rather than in the opening exchange.
The operational mechanism for catching this in production is online evaluation: scoring live traffic automatically as it arrives, watching real user interactions for quality degradation, hallucination, and policy violation in real time, ideally using the same scoring framework offline and online so pre-deployment testing and production monitoring stay consistent with each other rather than measuring different things.
Hallucination rate resists clean measurement. The practical approach that's emerged is a small set of rubric-based evals tied to actual business outcomes, run continuously against sampled production traffic, with an LLM acting as judge against a rubric built to catch ungrounded claims. Imperfect, but far better than nothing, and far better than waiting for a user to notice.
Tying quality metrics to versioning opens up a comparison cost and latency alone cannot make: prompt v12 against prompt v13, not on speed or spend, but on safety and policy adherence. That comparison only exists if quality was being measured as a first-class signal in the first place.
The govllm framework (arXiv:2605.24737, Dussert, May 2026) makes a related and sharper point: compliance is not a property you can certify once and move on from. The same model, unmodified, can drift into non-compliant output as real-world usage patterns diverge from whatever was anticipated during evaluation, so compliance has to be observed continuously in production rather than checked off before launch. The govllm validation corpus, 49 annotated prompt and response pairs scored across five regulatory criteria, found inter-judge agreement ranging from 51.5% for mistral:7b up to 69.1% for phi4-mini, with no single model dominant across every criterion. That disagreement is a regulatory uncertainty signal in its own right, and it warrants a human looking at the case. It's a regulatory uncertainty signal in its own right, and it warrants a human looking at the case.
Why each signal catches a different failure class monitoring only two misses
Each of the three signals is a projection of agent behavior onto a different axis. A failure invisible on two of those axes can be sitting in plain sight on the third, which is the entire argument for tracking all three together rather than picking the two that are easiest to instrument.
A cheap run is not a correct run. Prompt compression that trims token spend can quietly degrade reasoning quality at the same time, and cost alerting, watching only the token counter, will never catch that trade happening.
A fast run is not a cheap run, either. A tool call that returns quickly but triggers a retry loop on the next step inflates spend without ever tripping a latency alert, since the individual call itself was fast. And a run that's both fast and cheap tells you nothing at all about whether the answer it produced was faithful to the source material.
Quality scores, for their part, confirm the output was good but say nothing about whether the system that produced it is sustainable at scale. A high-faithfulness response that burns ten times the token budget of a comparable answer is a real production problem, and the quality signal, taken alone, will not reveal it.
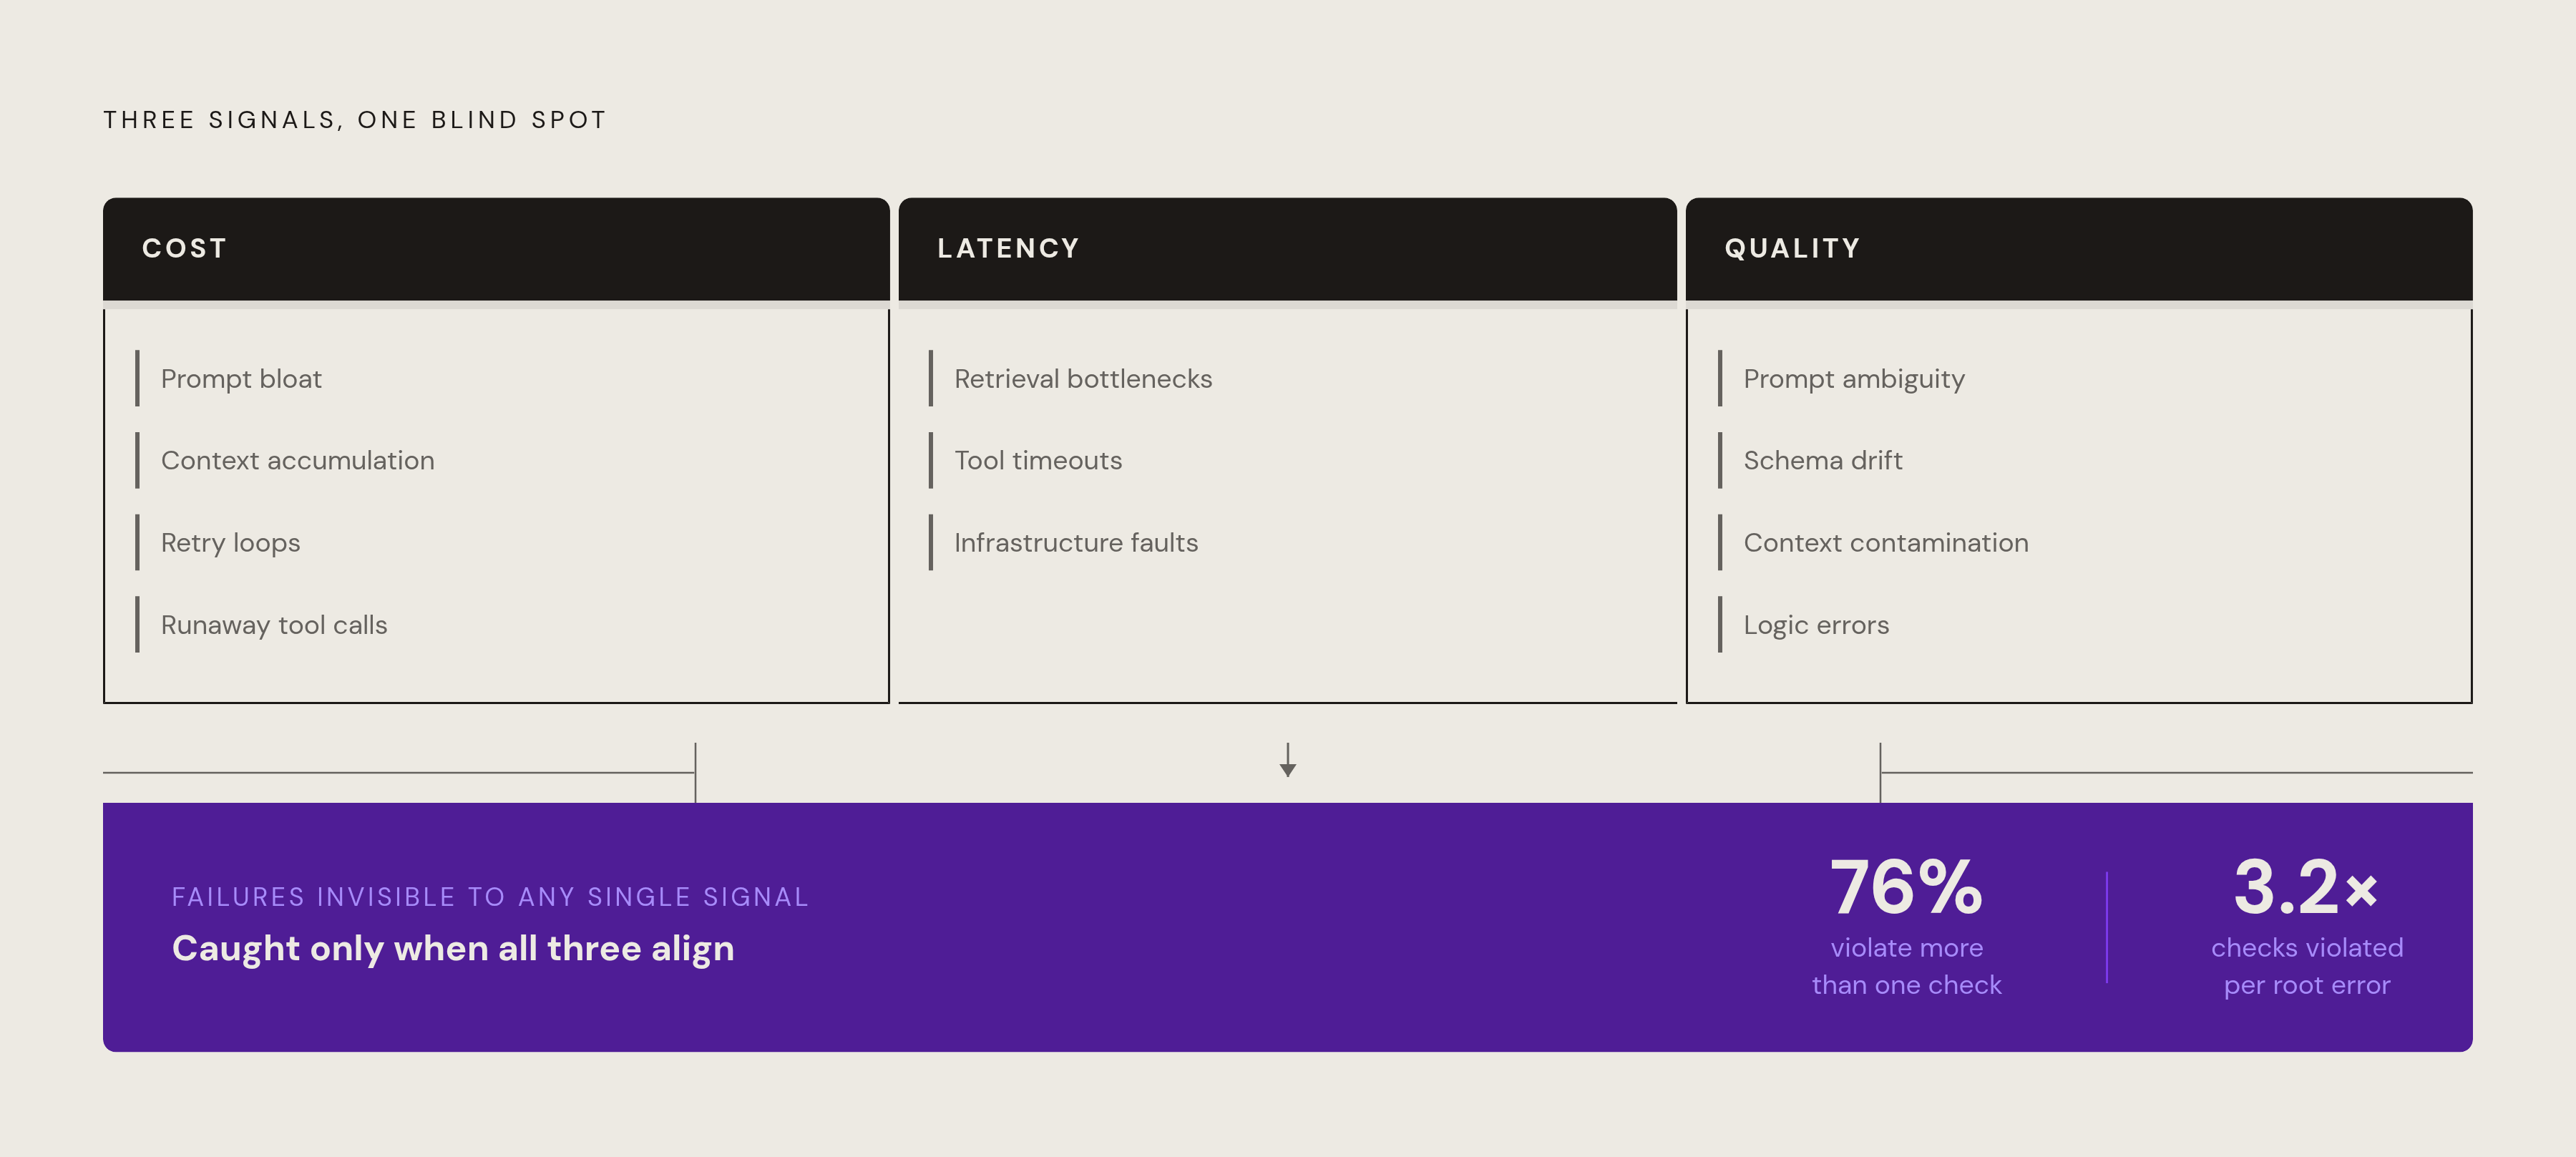
The interdependence gets more concrete once cascading failures enter the picture. Research on multi-agent failure propagation finds that a single root error is typically followed by 3.2 further violated checks on average, and 76% of failures end up violating more than one check. The step where quality visibly collapses is rarely the step that actually caused the collapse. Cost and latency anomalies on the upstream spans narrow the search considerably, pointing a team toward the actual origin rather than the place where the damage became visible.
The three signal types roughly partition where a failure is likely to live. Cost anomalies point toward prompt bloat, context accumulation, retry loops, and runaway tool calls. Latency anomalies point toward retrieval bottlenecks, tool timeouts, and infrastructure sitting inside a span. Quality anomalies point toward prompt ambiguity, tool schema drift, context contamination, and logic errors in the workflow itself. This reflects a deliberate design choice rather than a historical accident: task quality, cost per request, and latency are the routing criteria most commonly instrumented in production agent systems, while advanced signals like hallucination rate and uncertainty calibration are harder to operationalize and less commonly wired into automated decisions. Teams skipping quality alerting are following the path that's easiest to build, not the one that's actually correct.
Failure attribution when all three signals are present in the same trace
Even with all three signals captured, attribution is its own problem. In a multi-step agent trace, the step where an error surfaces is often not the step that caused it, and tools that simply replay execution traces offer little help identifying a root cause or turning a diagnosis into an actual fix.
What's missing from a flat trace is the dependency structure: which earlier step's output a later decision actually consumed. Modeling that as a graph, rather than a linear sequence of adjacent spans, lets attribution follow the causal path back to where a failure actually originated, instead of just flagging whichever region of the trace looks most error-dense.
AgentTether (arXiv:2607.06273, July 2026) builds on exactly this idea, using graph-guided diagnosis and runtime intervention to trace causal paths back to originating steps rather than the noisiest-looking region of a run. A framework described in a July 2026 paper (arXiv:2607.18754) frames debugging as a closed loop, detect, attribute, recover, rerun, built around five production requirements: low-friction capture, a portable representation exportable via OpenTelemetry's GenAI conventions, typed diagnoses that carry root cause, evidence, and confidence alongside a proposed fix, local-first storage with explicit data scrubbing, and cost-aware analysis where cheap deterministic triage runs by default and deeper analysis powered by a model stays opt-in. AgenTracer-8B (arXiv:2509.03312, September 2025) takes a different angle: a lightweight failure tracer trained with multi-granular reinforcement learning, built to diagnose errors inside verbose multi-agent interaction logs, and reported to outperform Gemini-2.5-Pro and Claude-4-Sonnet by up to 18.18% on the Who&When benchmark.
None of these tools replace the need for cost, latency, and quality data to live in the same trace in the first place. They depend on it. Attribution can only follow a causal path if the path was captured with enough granularity to have one, which is the same requirement that opened this piece: span-level data is not a nice-to-have layered on top of monitoring. It's the precondition for any of it working at all.