Handoff Points Between Observability Tooling and Harness Engineering
Observability shows what failed, but harness engineering fixes it—and most teams conflate the two.
What observability tooling actually produces and where its output stops
Agent reliability doesn't stall because teams lack visibility into what their agents did. It stalls because seeing the failure and fixing it are two separate jobs, and almost nobody has built a real workflow connecting the two. Observability tooling tells you a trace went wrong. It doesn't tell you which layer of the agent's harness caused that, and it certainly doesn't check a fix before you ship it.
By 2026, the furthest-along organizations had moved agents past pilot mode and into customer service, finance, security operations, and software delivery, though adoption across the broader enterprise landscape remained uneven. That shift changed what a failure costs. A wrong decision now touches revenue, compliance, or brand trust, not just a demo in front of a product manager. It also changed the question monitoring has to answer. The old question asked whether the system responded. The new one is whether the decision was correct, and traditional application performance monitoring was never built to answer that.
Per MLflow's guide, 73% of enterprises now say they need AI agent monitoring in production, while 63.4% cite a lack of adequate observability tooling as the barrier standing in the way. That gap runs deeper than the technical side. Most teams bought observability tools to solve a visibility problem, then found out that visibility and remediation are different disciplines, and only one of them came with a workflow attached.
A properly instrumented agent produces a full execution trace: every LLM call, every tool invocation, every memory read and write, every handoff between sub-agents, laid out as a structured hierarchy of spans. An LLM call span captures details about the model invocation itself. A tool invocation span captures what was called, what arguments were passed, and what came back. Memory spans log what was read or written. Handoff spans record the transfer between sub-agents. Reasoning spans, where available, capture intermediate thought and which decision branch was taken.
Shared trace schemas allow traces built on different frameworks to land in the same backend without someone hand-writing a parser for each one. Because spans carry structured metadata, teams can run cross-trace queries: show every trace where a given tool failed for a specific user segment over the last 48 hours. That's a real capability, and it's a meaningful step past single-trace replay.
What none of this produces, on its own, is a decision. A trace doesn't tell you which component in the harness caused a bad outcome, and it doesn't hand you a fix. It answers what happened and where in the execution it happened. It doesn't answer which layer is at fault or what should change as a result. Per MLflow's guide, combining behavioral monitoring (what the agent did) with reasoning monitoring (why it did it) lifts threat detection accuracy by 35% and makes nuanced attacks about four times more likely to get caught. That's a real gain, but even that richer signal is diagnostic. The trace surfaces the failure. It doesn't attribute it, and that gap is the whole subject of what follows.
The agent harness as the engineering surface observability exposes
The harness turns a raw language model, a stateless text-completion engine, into something stateful and goal-directed: capable of reasoning across multiple steps, calling tools, pulling from memory, and touching systems outside itself. It's built from distinct, editable layers, and each one fails in its own way.
Prompts encode the behavioral rules, the task policies, the reasoning procedures, all written in plain language. Tools expose external services through action schemas, invocation formats, and validation rules. Memory stores past observations, past outcomes, and reusable strategies for later retrieval. Skills package procedures into reusable modules. Workflow and orchestration logic governs how tasks get broken down, how work routes between sub-agents, how retries happen, how coordination gets enforced.
The model supplies judgment. The harness makes the task legible, executable, and checkable. Most teams get this backwards: they treat a bad outcome as a model problem and reach for a bigger model, when the trace usually points at a stale tool schema or a decomposition step that drifted. Upgrading the model alone tends to produce smaller gains than expected when the infrastructure around it is shaky. Each harness component leaves its own signature in the trace, and reading that signature correctly is the whole job of root cause attribution.
The Agentic Harness Engineering framework, described in research at arxiv.org/abs/2604.25850, makes this connection explicit by pairing observability with harness editing across multiple structured pillars covering the editable components, trajectory evidence, and the predicted and actual effects of changes. It's a formal treatment that designs observability specifically to feed harness editing, rather than just feeding an alert dashboard.
The three failure categories that live in production traces and which harness layer each implicates
Multi-agent LLM systems fail often. Research using the MAST taxonomy (Cemri et al., NeurIPS 2025), validated across more than 1,600 execution traces, puts production failure rates between 41% and 86.7%, with specification ambiguity and unstructured coordination protocols responsible for 79% of the breakdowns. The majority of failures trace back to how the system was specified and coordinated.
The failures sort into three categories, and the trace reads differently for each one. At the LLM level, the prompt layer, instruction violations, ambiguous task framing, or outright hallucination appear in the trace as a correctly invoked tool paired with the wrong reasoning or the wrong output. The failure signature points straight at the prompt, not the tool. At the tool and interaction level, failures look like bad tool selection, wrong arguments, schema mismatches, or missing context. Per Trantor, tool misuse and incorrect arguments account for roughly 31% of production failures in 2024 to 2025 deployments; the trace shows a tool call going out with malformed input or coming back with something unexpected. At the flow and coordination level, no single step throws an error, but task decomposition drifts, sub-agents miscoordinate, and the cumulative effect is a wrong final answer.
This last category is the one teams underrate most, because nothing in the trace looks broken step by step. Research cited at latitude.so found that agents graded only on final-output quality pass 20% to 40% more test cases than a full trajectory review would allow. A lot of quietly broken reasoning is passing as success, and grading on the final answer alone is how it keeps passing.
The most dangerous version is the cascading, silent failure: a wrong argument at step two corrupts everything downstream, and every subsequent span still looks plausible on its face. FlowFixer, described at arxiv.org/pdf/2607.02882, is a repair framework that uses structured prior knowledge plus assertion checks to pin a failure to a specific node before it tries to generate a fix. Knowing a run failed tells you almost nothing on its own. The same visible failure, a wrong final answer, can trace back to the prompt, a tool schema, or the orchestration logic, and each of those demands a completely different fix.
Three specific failure patterns where the trace-to-harness handoff breaks down in practice
Tool schema drift happens when a harness gets built against a specific version of a tool's schema, and then the tool updates while the harness doesn't. In a February 2026 postmortem covered by atlan.com, n8n's upgrade from version 2.4.7 to 2.6.3 caused the platform to generate invalid JSON schemas for tool definitions, breaking both OpenAI and Anthropic integrations at once, because the argument schema changed between versions with no mechanism to warn the harnesses consuming it. Schema drift rarely throws a clean error. It produces something malformed but plausible, which sails through until a human notices the outputs are wrong. The trace itself shows a "successful" tool call sitting on top of corrupted data. The fix here has nothing to do with the model. It's version pinning on tool schemas and automated diffing whenever a tool updates.
A related problem is context drift. MemU's research, cited via atlan.com, found that context degrades by roughly 2% per step across multi-step workflows, and after five cycles less than 60% of the original context remains reliably accessible. The same source attributes 65% of enterprise agent failures to context drift rather than to any defect in the model or its architecture. The fix again lives in the harness, in a compaction strategy that keeps old information from silently rotting.
Prompt ambiguity interacting with harness configuration causes a third pattern, and this is the one that resists a clean fix, because nothing about it looks like a bug. The same prompt can produce different tool call sequences depending on temperature, retrieved context, or what's sitting in memory from a prior turn, and the trace just shows behavioral variance with no obvious culprit. Anthropic's April 2026 postmortem on Claude Code, referenced in the awesome-harness-engineering repository, traced a quality regression to three separate harness-level changes happening at once. A default downgrade in reasoning effort, a caching bug that kept dropping thinking history, and a system prompt that clamped down too hard on verbosity all landed together. No single change broke anything on its own. It was the interaction of all three that produced the visible degradation, and that's exactly the kind of failure a trace alone won't decompose for you. The fix requires prompt versioning tested against real traffic, plus a way to isolate which of several concurrent changes actually caused the shift.
Workflow loops make up a fourth pattern, though they're really a variant that deserves separate treatment: an agent calls the same tool with the same arguments over and over, or bounces between two sub-goals that each wait on the other to finish, and the whole thing only ends when a hard timeout kills the session. The retry version is its own trap. A tool errors out, the agent retries with identical arguments, gets the identical error, and retries again, with token cost and latency compounding on every pass (per latitude.so). Even well-built production systems see a steady baseline rate of tool failures from ordinary network timeouts, and every one of those is a potential loop trigger if the orchestration layer has no way to detect a loop forming. The fix belongs in orchestration: loop detection, retry logic with exponential backoff, and argument mutation on retry, instead of repeatedly firing the same call and hoping for a different result.
In all three patterns, the observability layer does its job. The trace makes the pattern clearly visible. What it doesn't do is decide which harness component to edit or how, and that decision requires a separate step that most teams never formalize.
The undefined handoff from trace to harness fix in most teams
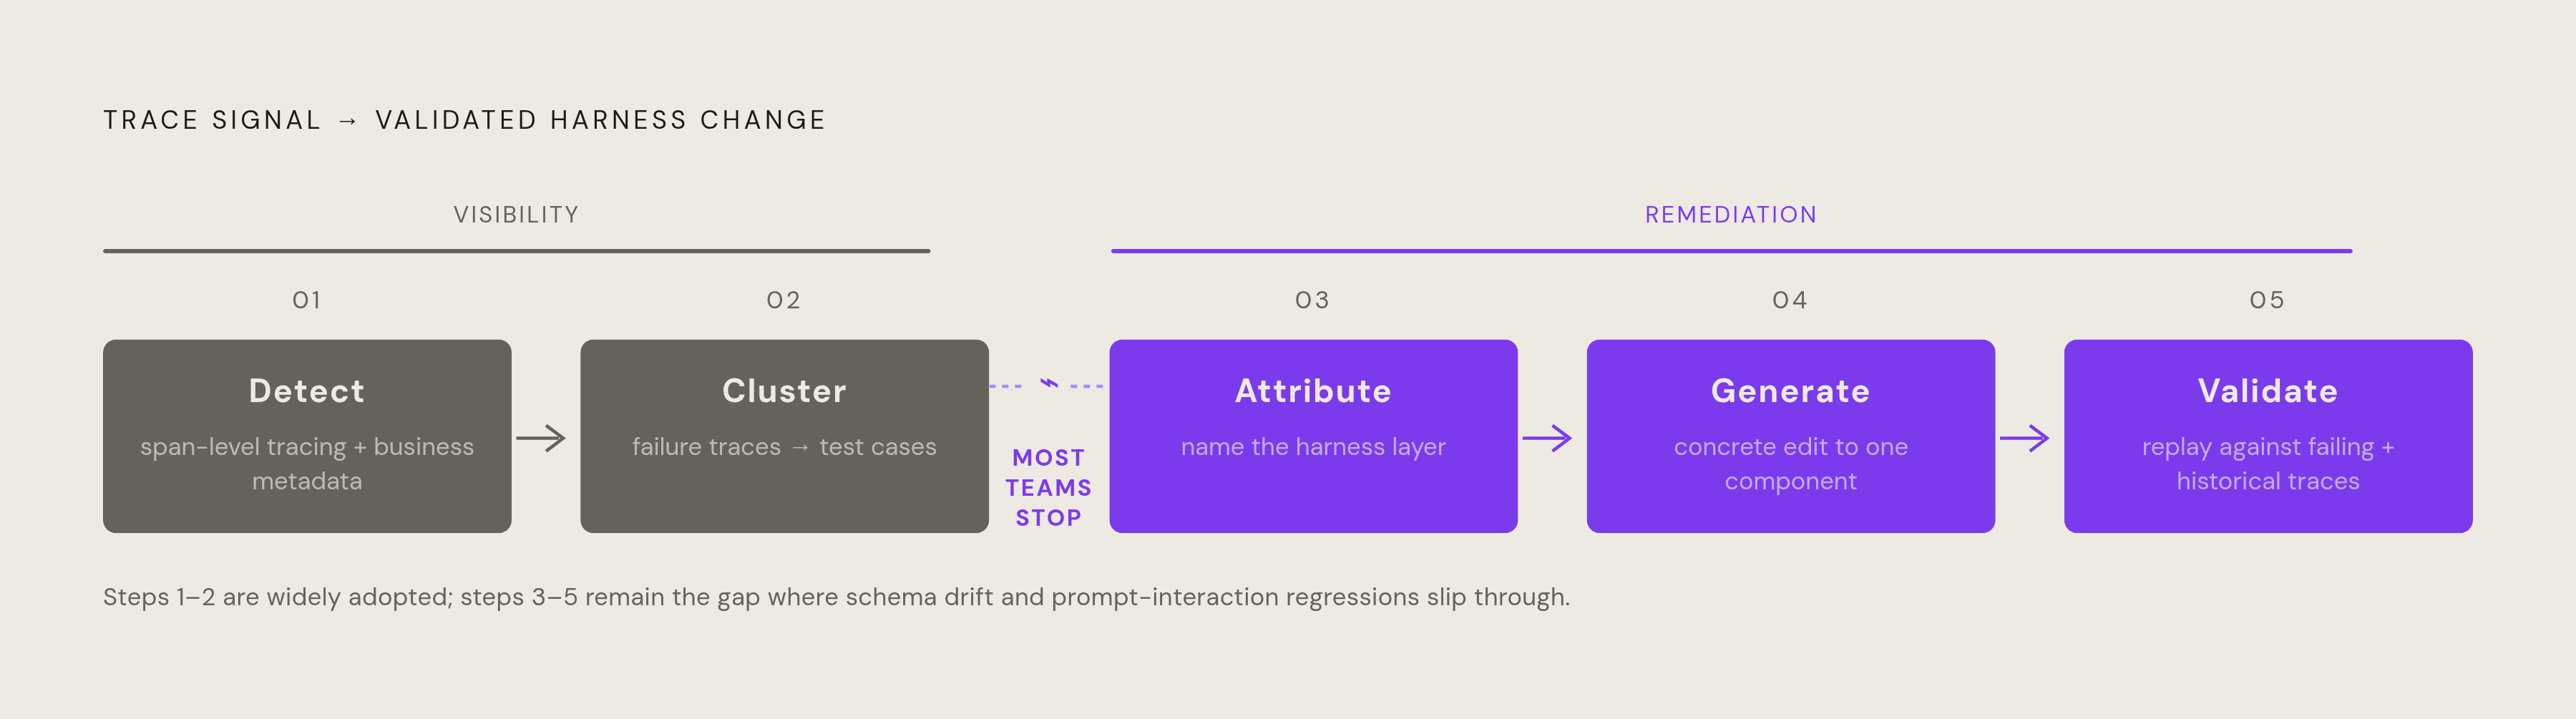
Observability tooling is built to detect and surface failures. It isn't built to pin them to a specific harness layer, generate a candidate fix, or check that fix against historical traces before it ships. Practitioner literature describes a four-step diagnostic path: trace collection, failure clustering, root cause analysis, then eval generation (per latitude.so). Most teams stop after the first two steps and let human judgment take over from there, with no structured handoff to carry the work forward.
The pattern repeats often enough to be predictable. An alert fires, or a user files a complaint. An engineer opens the trace, spots something that looks like the cause, and edits a prompt or a tool schema. The change ships without ever being replayed against the traces that actually showed the failure. Later, a regression appears somewhere else in the harness, because nobody tested for the interaction effect between the new change and everything already in place.
Failure clustering, automatically reducing hundreds of individual error events down to a short list of actionable patterns, is what separates systematic improvement from constant firefighting (per latitude.so). It only works, though, if the trace data is structured and tagged well enough to support it, and that's exactly where the observability adoption gap bites hardest. Teams without span-level tracing can't cluster failures in any meaningful way, so the handoff never even starts from a clean signal. Harness changes end up made on gut feeling drawn from one trace at a time, rather than on evidence drawn from a pattern across many, which is precisely how schema drift and prompt-interaction regressions slip through and come back later.
A defined handoff workflow: from trace signal to validated harness change
A workable loop runs in five steps: detect a failure in production, turn representative traces into test cases, attribute the failure to a specific harness layer, generate a concrete and reviewable change, then replay that change against historical traces before it ships.
Detection needs span-level tracing tagged with business metadata, user_id, session_id, tool version, because without those tags, clustering has to happen by hand and stays incomplete. Attribution has to name a layer specifically, such as "the tool argument schema was wrong at step 3 because the harness was still pinned to an outdated version."" Change generation should produce a concrete, inspectable edit to one component, such as a line of prompt text, a tool schema, a retry rule, or a memory compaction policy, something a person can read and evaluate directly. Validation means replaying the candidate change against both the traces that showed the original failure and a broader sample of historical traces, to catch a regression before it reaches production rather than after.
Replay matters because ordinary logs can't reproduce a non-deterministic LLM failure, and per MLflow's guide, trace-level replay for debugging is now treated as a baseline requirement, not a nice-to-have. A fix that resolves one failure pattern can just as easily introduce another, and replay is the only way to catch that before a user does.
There's already a documented example of what a validated harness change looks like in practice. Per the awesome-harness-engineering repository, Anthropic's server-side context compaction cut token consumption by 84% in a 100-turn web search evaluation, letting agents finish workflows that previously ran into context limits before completing. That's a harness-level change with a measured, replay-checked outcome, achieved through the harness itself, not through a bigger model. Separately, LLMLingua prompt compression reaches up to 20x compression with little loss in performance, and LLMLingua-2 adds another 3x to 6x in speed for latency-sensitive agent loops (per the same source). Both are harness changes, and both are the kind of thing that gets measured against historical traces rather than taken on faith.
Reviewability isn't optional here. Engineers responsible for agent reliability need to see what changed and why, because an opaque auto-fix that can't be inspected just reintroduces the same trust problem that made the harness fragile to begin with. Once a fix ships, the loop closes: new traces come in, and the same failure pattern gets watched for recurrence. This runs continuously off production signal.
Handling of the handoff in current observability platforms
MLflow, named the top pick in its own 2026 guide, offers end-to-end agent tracing with structured spans across every sub-agent call, tool invocation, and retrieval step. It supports trace replay, an exact reproduction of a call sequence for debugging failures that won't repeat the same way twice, and it includes prompt versioning. That combination, structured tracing plus replay plus versioning, covers more of the handoff than detection alone.
The attribution step, deciding which harness layer actually caused a given failure, and the validation step, confirming a fix doesn't regress elsewhere, still depend on the structured research described above (the AHE framework, FlowFixer's taxonomy) being applied on top of the trace data. Neither ships as a built-in feature of the observability layer itself, and that gap is the whole point of this piece: the tooling gets a team most of the way to the fix, but the last stretch still takes a workflow someone has to build. Right now, that someone is whoever on the team decides to stop treating the trace as the end of the job instead of the start of it.