LLM Tracing Tool Alternatives Compared
Tier 2 platforms pinpoint which layer of your agent failed, not just that something broke.
An LLM agent's run can hand the user a confidently wrong answer even though tracing tools all capture spans and token counts by now, but what actually separates them is whether they can point to which layer of the system broke, rather than just flagging that something did. Standard application performance monitoring was built for a different failure mode. It watches latency, error rates, and uptime, and none of those metrics say anything about a hallucination, a wrong tool selection, context that's gone stale, or a policy the agent has quietly drifted away from. LLM Tracing Tool Alternatives Compared.
Agent failures don't live in a single call. They emerge across a chain of decisions, so seeing them at all requires a full-session trace, not a snapshot of one request-response pair. Agent failures emerge across a chain of decisions, so the unit worth analyzing has shifted from the model call to the task itself, made up of tool invocations, retrieval steps, sub-agent handoffs, state changes, and planning decisions, each one a link in a chain that can break without tripping any conventional alarm. Once that shift is accepted, the real question for anyone evaluating these platforms changes: once you've got the trace, what can the tool actually tell you about why the thing failed? Agents fail silently: HTTP 200 returns even when an agent loops through many tool calls, burns tokens, and delivers a confidently wrong answer.
The axis that matters: failure attribution depth, not trace capture
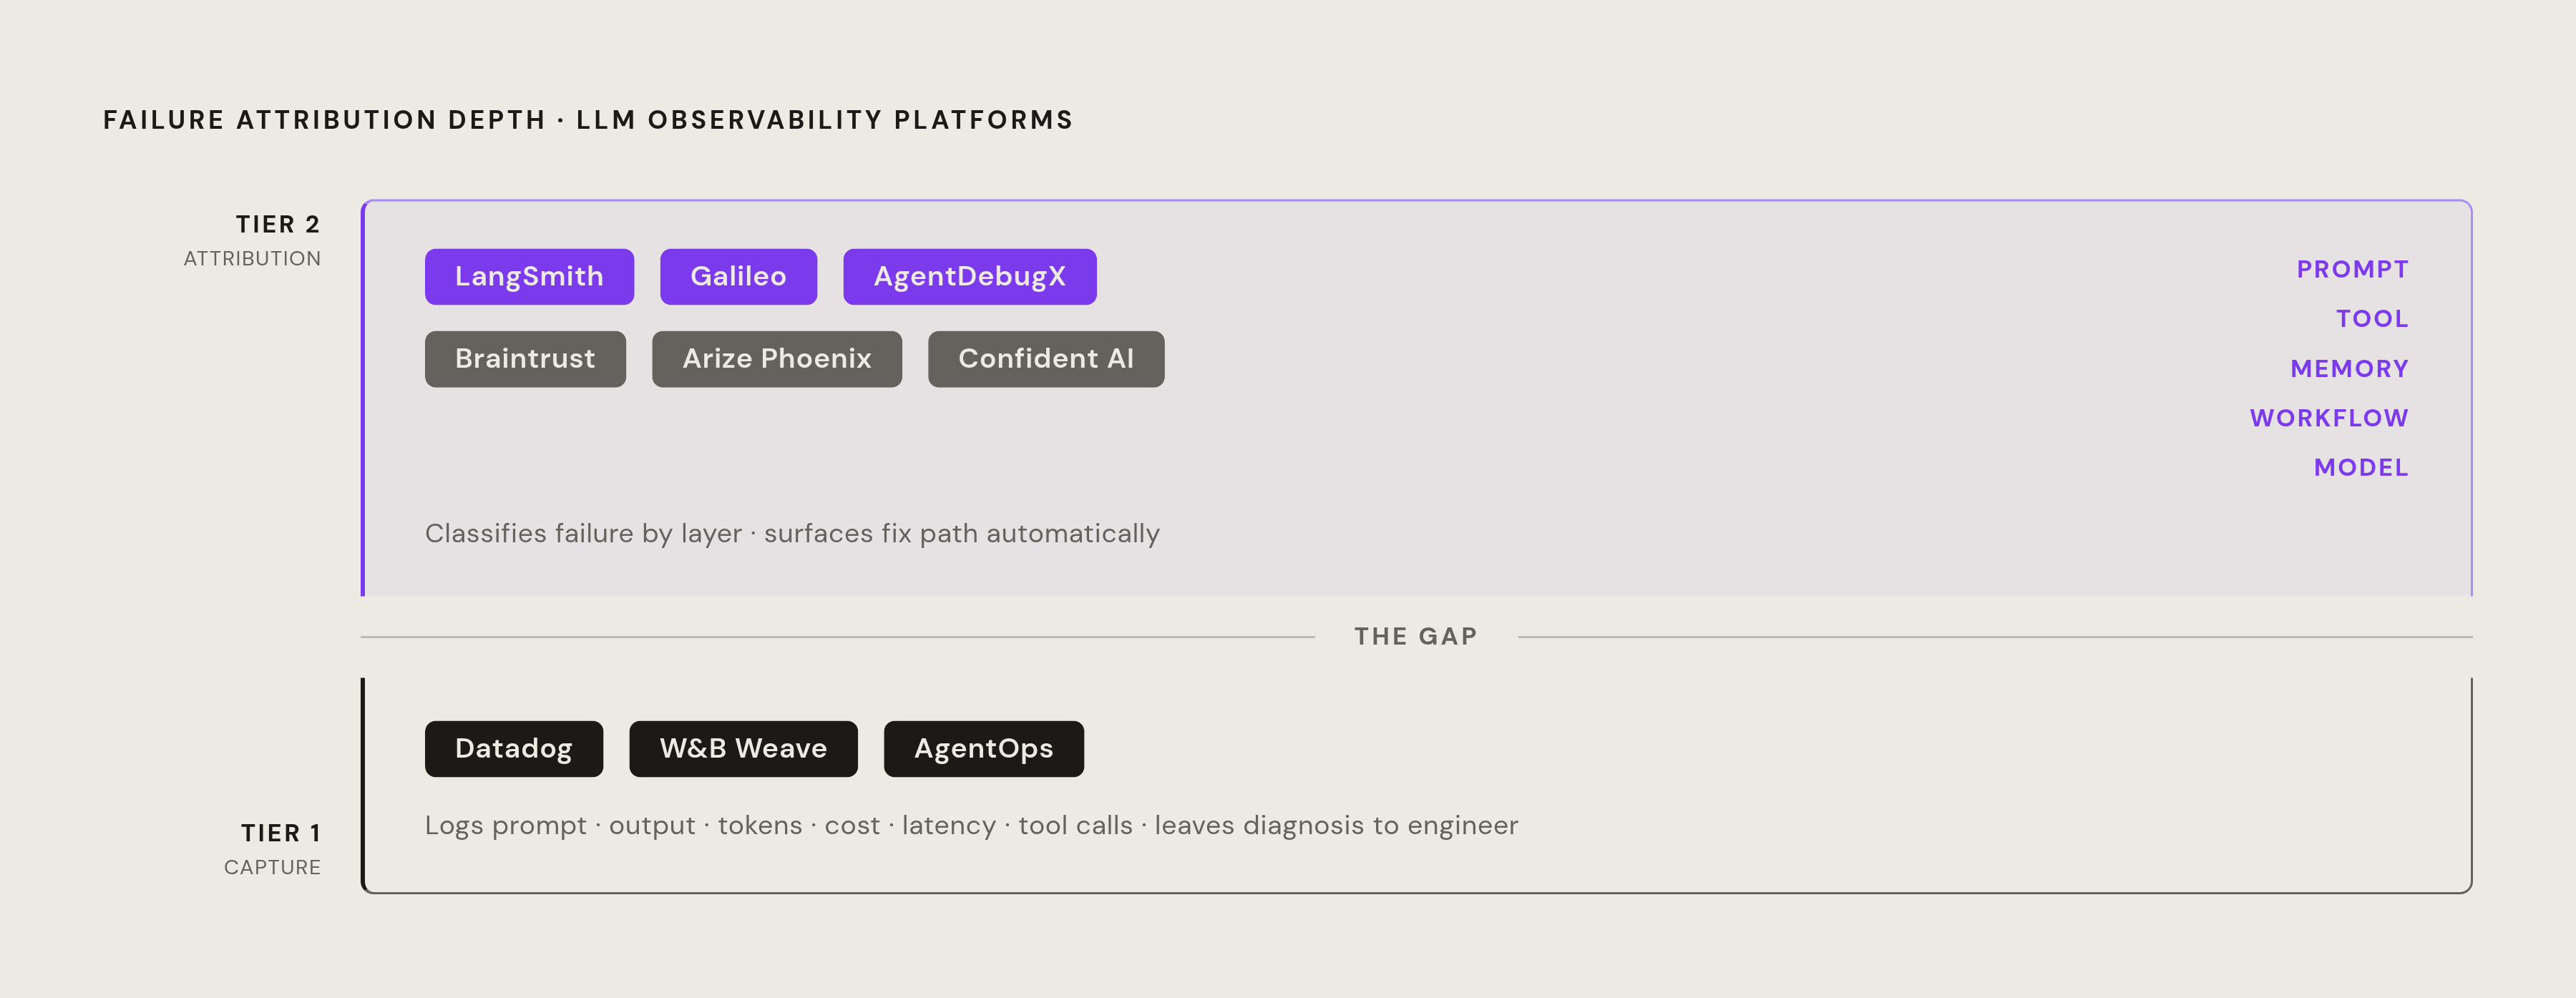
Every platform in this comparison captures spans. That part of the market has matured to the point of being table stakes, and it is no longer a meaningful differentiator on its own. The real split appears in what happens after the trace lands on someone's screen.
Two tiers exist. Tier 1 is trace capture and replay: logging the prompt, the output, token usage, cost, latency, and the tool calls made along the way, then leaving the diagnosis to whichever engineer gets paged. Tier 2 goes further. It classifies the failure by the layer responsible, prompt, tool, memory, workflow, or model, surfaces that classification without anyone having to write a query to dig for it, and ties it to a fix path an engineer can actually act on.
The distinction is not cosmetic. Research on AgentDebugX found that the step where an error becomes visible is often not the step that caused it. Apply a correction at the point where the failure surfaced, decoupled from the actual root cause, and the fix fails systematically whenever that root cause sits several steps upstream. Knowing a run failed tells an engineer almost nothing. Knowing which layer failed, and why, is the only version of that signal worth building a workflow around. Attribution depth is the axis the rest of this piece measures every platform against.
The agent harness as the most likely failure site
An agent in production is never just a model. It's a model wrapped in a harness: a prompt template, a set of tool schemas, memory or retrieved context, planning and revision logic, and some layer of output verification sitting on top. The harness is what decides how the model, the tools, the memory, the control flow, the permissions, and the telemetry all talk to each other, and each one of those pieces is its own distinct place for things to go wrong.
A few failure categories get fixed in completely different ways. Prompt ambiguity is underspecified instruction that produces inconsistent or off-policy output. Tool schema drift happens when a tool's definition no longer matches the API it wraps; that mismatch causes silent wrong-tool selection or malformed calls that don't announce themselves. Workflow loops occur when an agent re-enters the same planning step over and over without making progress. Memory or retrieval errors inject stale or irrelevant context straight into the prompt, poisoning everything downstream of it.
A growing body of 2026 research argues that the harness, not the underlying model, is often the dominant factor in how well an agent performs. That result reframes what a tracing platform needs to do.
Platforms with the deepest failure attribution
LangSmith sits near the top of this tier. LangSmith Engine clusters production failures into prioritized issues, traces them back to root causes in the code, and proposes fixes for a human to review. Polly, its built-in AI assistant, summarizes large traces so an engineer isn't scrolling through thousands of spans looking for the one that matters. LangGraph Studio adds breakpoints, lets engineers modify state mid-run, and resumes from checkpoints, though this attribution power is most useful for teams already inside the LangChain or LangGraph ecosystem. The platform is closed source, self-hosting is restricted to Enterprise tiers, and of the platforms reviewed here it carries the highest vendor lock-in risk. Pricing starts free at 5,000 traces a month, with Plus running $39 per seat monthly.
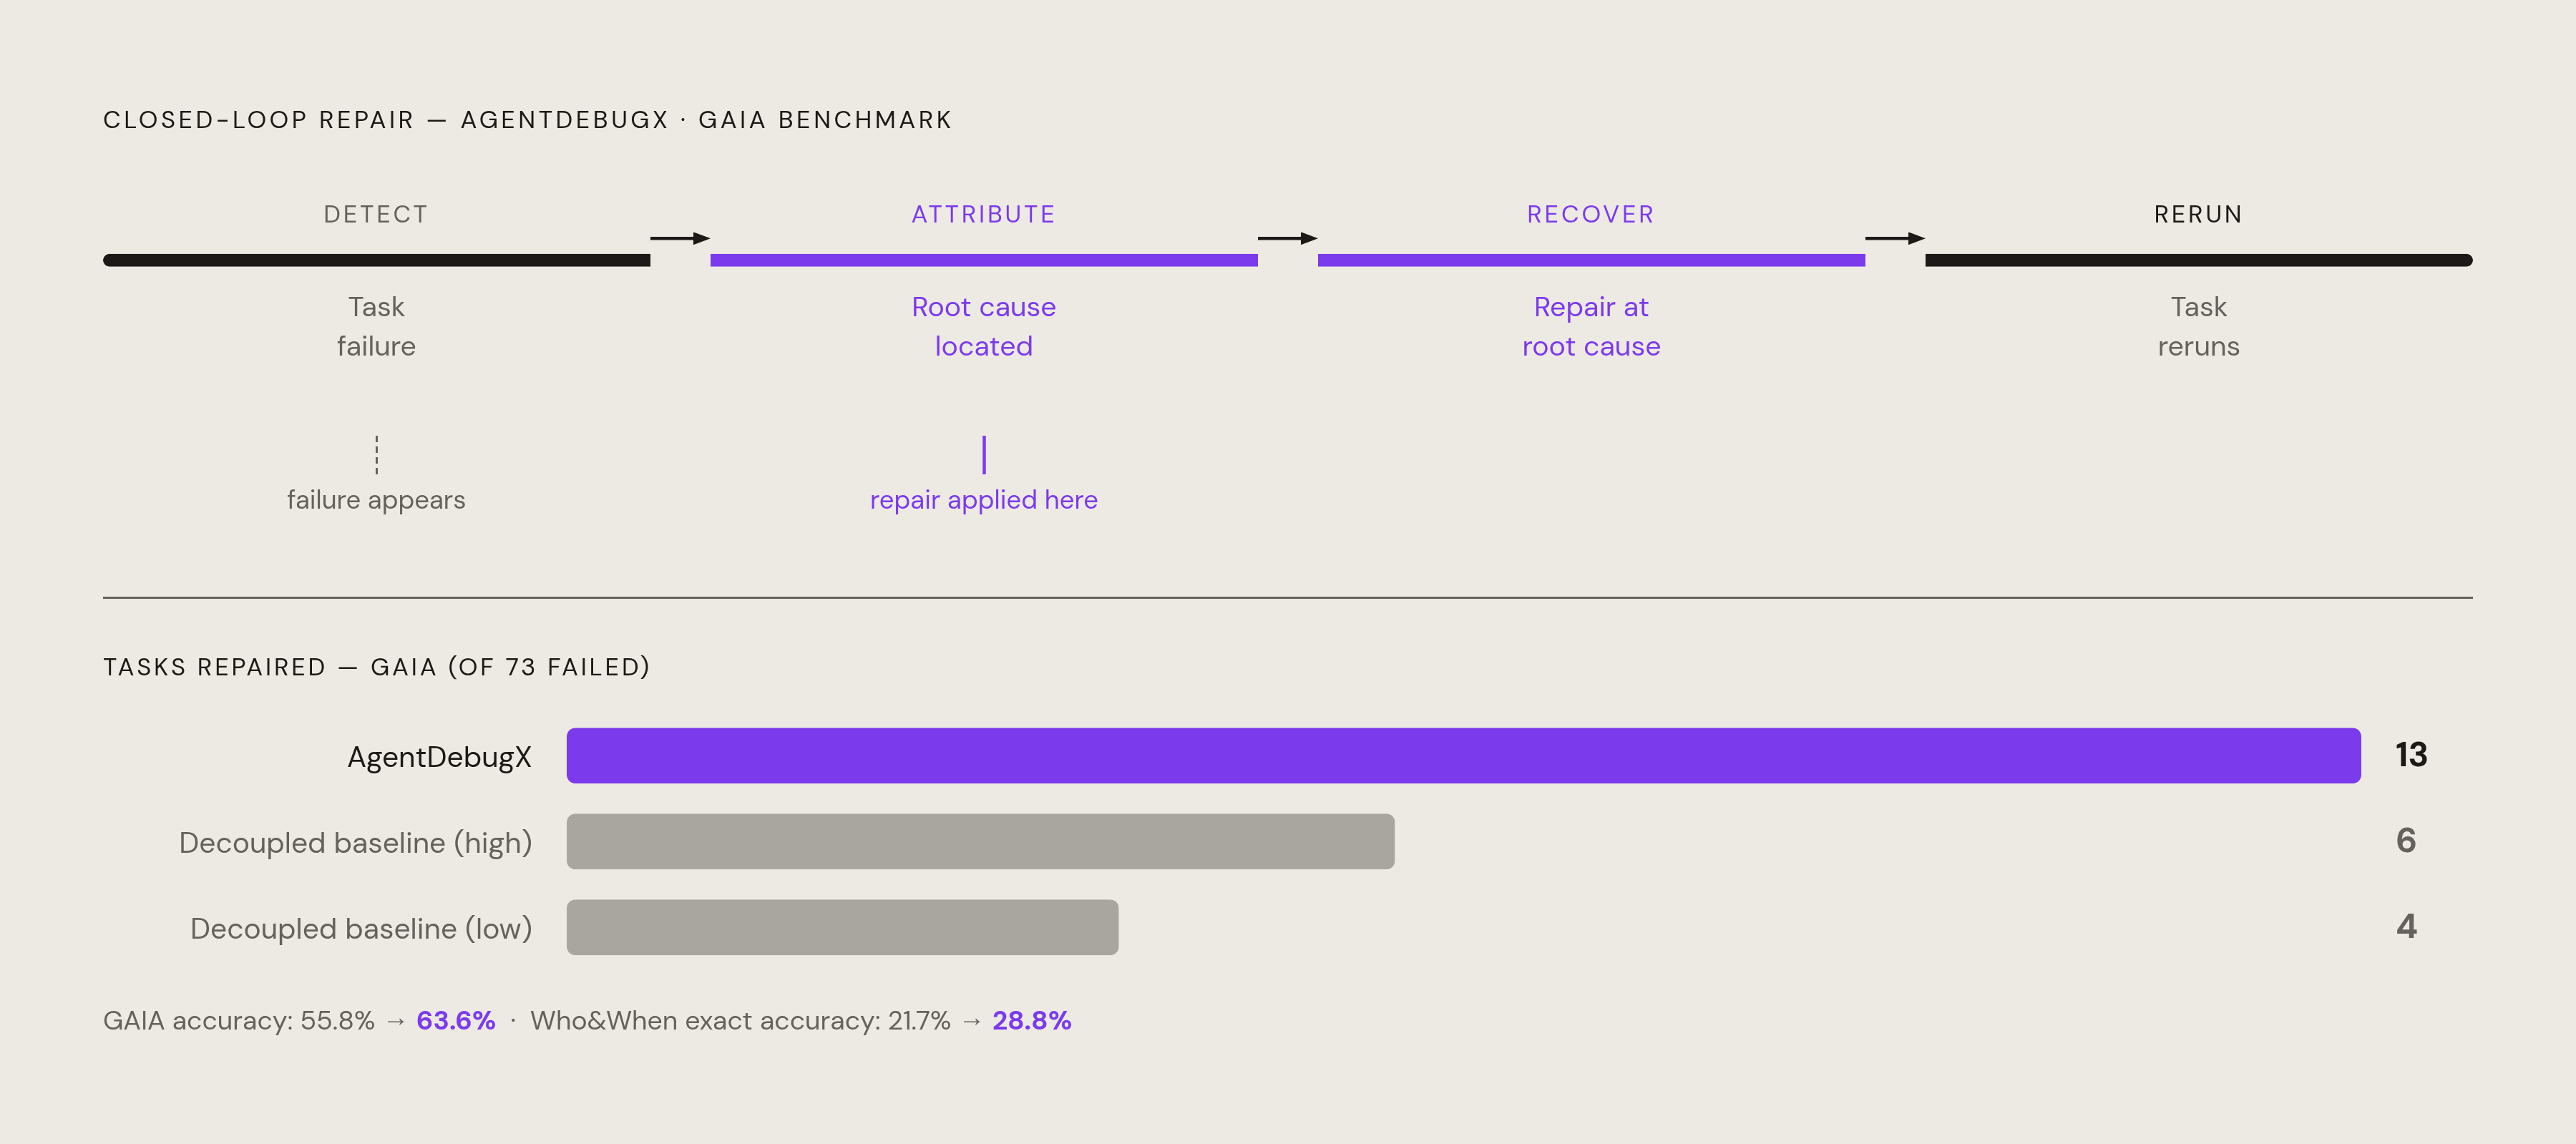
Galileo takes a different route to the same depth of attribution. Its Luna-2 models run full-traffic evaluation at sub-200ms latency and at 97% lower cost than a standard LLM-as-judge setup, which matters because it's the only platform in this comparison that makes evaluating every single production trace economically realistic instead of falling back on sampling. Its Signals feature uses ML clustering to surface issues on its own, and evaluation runs continuously rather than waiting for someone to trigger it. Pricing sits on request, with a free tier at 5,000 traces a month and Pro starting at $100 a month billed annually. It is open-source (MIT) with 4,300+ GitHub stars; free at 20K credits/month; Pro $99/month; self-hosted free (MLflow, Top Open Source LLM Observability Tools in 2026: Compared). On the GAIA benchmark, the closed-loop approach repaired 13 of 73 failed tasks in a single rerun versus 4–6 for decoupled self-correction baselines, improving overall task accuracy from 55.8% to 63.6%.
AgentDebugX belongs in this tier too, though it's a different kind of thing entirely: a research-grade open-source toolkit, published as arXiv:2607.18754 in July 2026, built explicitly to close the attribution gap that commercial observability platforms have left open. Its DeepDebug component performs multi-turn root-cause diagnosis by understanding the full trajectory of a run, guiding investigation by structure, and cross-examining candidate explanations. The workflow it uses, Detect, Attribute, Recover, Rerun, applies the repair at the attributed root cause rather than wherever the failure happened to surface. On the Who&When benchmark, DeepDebug hit 28.8% exact agent-and-step accuracy against 21.7% for the strongest single-pass baseline. It's exposed through a Python library, a CLI, a web console, and an installable agentic skill, with an opt-in Error Hub for sharing scrubbed failure-diagnosis-repair bundles as reusable debugging memory. It isn't a production SaaS product, and it isn't trying to be one; it's a research toolkit that is quietly setting the attribution standard the commercial platforms are converging toward. The MCP server closes the loop to an opened PR: detected issue → coding agent (Claude Code, Cursor, or similar) → fix → PR, without leaving the platform. Of the 12 platforms Latitude compared, Latitude is the only one that closes the issue-to-PR loop.
Platforms built around eval rigor and regression prevention
Tracing without evaluation is just expensive logging, and Braintrust starts from that premise. It ships more than two dozen built-in scorers, extensible through natural-language descriptions rather than code, and its loop from failed trace to test case to CI regression test runs in minutes rather than days. Arize's own July 2026 guide places it well for evaluation-first development, while noting its attribution layer runs narrower than what LangSmith Engine or Galileo offer.
Arize Phoenix brings a different lineage to the table. It's built on the OpenInference standard, itself layered on OpenTelemetry with spans exported via OTLP, and it connects to more than 40 frameworks MLflow. Phoenix itself is free and open source under MIT, while Arize AX Free covers 25,000 spans a month and AX Pro runs $50 a month MLflow. Taken together, Arize AX and Phoenix offer the broadest combined workflow in this comparison for framework-agnostic tracing, production monitoring, experiments, and evaluation, with enterprise governance and deployment features reserved for AX Enterprise at pricing on request.
Confident AI is built for a different kind of buyer: organizations standardizing evaluation, monitoring, security, and governance across several product teams and model stacks at once. It converts traces into a continuous quality loop covering full trace visibility, evals on every step, research-backed metrics, human feedback, anomaly detection, and a trace-to-dataset pipeline. McKinsey's State of AI trust research from 2026, cited in Confident AI's guide, names a lack of trace-level visibility and quality measurement among the top reasons agent rollouts stall. It offers a free plan, usage-based paid tiers, and custom Enterprise pricing, available both in the cloud and self-hosted. The free tier offers 1M spans/month and 10K eval runs, with Pro at $249/month. ML-grade evaluation primitives were built for ML observability before LLMs existed, and that rigor carries into agent eval workflows.
Open-source and self-hosted options: tracing depth vs. operational overhead
MLflow covers tracing, evaluation, prompt optimization through its GEPA and Metaprompting algorithms, and AI Gateway governance, all in one platform with 60+ framework integrations via OpenTelemetry and no enterprise paywall gating any of it. The AI Gateway centralizes LLM routing, rate limiting, fallbacks, and credential management across providers. Self-hosting is comparatively straightforward, and teams that self-host get unlimited data retention with no forced expiry. MLflow's own guide positions it as the top pick for teams that want to own their trace data and want a complete platform without hitting a paywall halfway through.
This platform manages prompts outside the application codebase entirely, letting teams version, experiment with, and deploy prompts without coupling any of that to an engineering release cycle, which matters directly for attributing failures to the prompt layer specifically. Its trace model is solid, though it isn't built agent-first, and discovering issues or building evals from production data still takes manual effort. Running it yourself means operating several services alongside ClickHouse, and that operational load is not trivial. It is AGPL-3.0 licensed, built on OpenTelemetry, and delivers approximately 140x lower storage costs in typical log workloads compared to Elasticsearch-based stacks, per OpenObserve's comparison documentation (last updated September 2, 2026), though actual results vary by data entropy and cardinality.
Agenta takes a narrower but useful angle: an MIT-licensed LLMOps platform that pairs observability with a prompt playground, prompt management, and evaluation. It traces every request so teams can trace failures across individual reasoning steps, and domain experts can annotate those traces directly with feedback. Its issue discovery works through request-level tracing plus manual annotation, which surfaces problems once someone goes looking rather than continuously and on its own. Its attribution depth is lower than what LangSmith or Galileo offer, and its real strength is in prompt experimentation workflows rather than deep failure classification. Data retention runs 30 days on the free tier and up to 3 years on Pro, with Hobby at 50K units/month, Core at $29/month, and cloud starting at $59/seat for teams avoiding self-hosting (Top Open Source LLM Observability Tools in 2026: Compared). It has 30M+ monthly PyPI downloads, is governed by the Linux Foundation, and carries an Apache 2.0 license (Top Open Source LLM Observability Tools in 2026: Compared).
OpenObserve solves a different problem. It's the strongest fit for teams that also need infrastructure monitoring, since it unifies LLM tracing with logs, metrics, and infrastructure telemetry inside one self-hosted deployment. It runs continuous LLM-as-judge scoring at the span, trace, or session level, which means no separate eval tool needs bolting on. Its agent-specific attribution runs narrower than the agent-first platforms covered above; its real value is eliminating a second monitoring stack entirely, not deep failure classification. It is the most widely adopted open-source LLM observability platform in 2026 per multiple sources, MIT-licensed and self-hostable on Postgres + ClickHouse. It has 15M+ monthly PyPI downloads and 60+ framework integrations via OpenTelemetry.
Enterprise-default and infrastructure-integrated options
Datadog LLM Observability makes the most sense for teams that need to correlate agent behavior against an application and infrastructure stack that already lives inside Datadog. Its free plan covers 40,000 LLM spans a month with 15-day retention and full feature access, while Pro runs $160 a month billed annually for 100,000 spans. That 15-day default retention runs short for any team trying to build evaluation datasets out of older production failures, and extending it costs more. It's hosted SaaS only, with no open-source or self-hosted path, and its attribution depth leans on Datadog's existing APM correlation rather than any agent-native failure classification built from scratch.
Weights & Biases Weave follows a similar logic for a different existing user base: it's the obvious path for teams already running W&B for ML experiment tracking and model registry work, since it's the same platform, the same login, the same dashboards they already use. Its trace view is decent, its eval harness is strong, and it connects to more than 50 frameworks. Teams with no existing W&B commitment are generally better served by agent-native alternatives on the attribution axis specifically.
AgentOps rounds out this tier with a focus on breadth: it supports more than 400 LLMs and the major agent frameworks, and Latitude's March 2026 guide names it the strongest option for multi-framework agent debugging. Its time-travel debugging replays an agent session from any point in its execution, which is a genuinely useful feature for reconstructing what happened step by step. Its evaluation and experiment workflow runs narrower than the full lifecycle platforms covered earlier, with a Basic free tier at 5,000 events and Pro starting at $40 a month. The free tier provides 1 GB of Weave ingestion per month, while Pro starts at $60/month (including 1.5 GB Weave ingestion/month, then $0.10/MB thereafter), meaning data-volume pricing needs careful modeling for large prompts and rich traces.
Instrumentation standards that determine what attribution is even possible
The attribution features described above depend on the instrumentation beneath them capturing the right data. OpenTelemetry has become the connective layer across nearly every platform in this comparison, from the open-source, self-hostable options through to the enterprise SaaS products, precisely because it standardizes how spans get exported and consumed across tools that otherwise share nothing in common. OpenInference builds directly on top of OpenTelemetry to capture LLM-specific events that generic APM instrumentation was never designed to record, and that extension is what makes prompt-layer and tool-layer attribution possible at all rather than just latency and error counts MLflow.
The instrumentation layer is the precondition for the attribution story, not a footnote to it. It is the precondition for it. A platform can build the most sophisticated clustering algorithm or the sharpest root-cause model in the industry, but if the underlying trace never captured which tool schema fired, what the retrieved context actually contained, or where the planning loop re-entered itself, none of that sophistication has anything to work with. The platforms that separate themselves in this comparison share this in common: attribution depth is downstream of instrumentation depth. AgentDebugX research (arXiv:2607.18754, July 2026) found that the step where an error surfaces is often not the step that caused it, and decoupled self-correction applied at the visible failure point fails systematically when the root cause is several steps back; one platform, well suited to evaluation-first development per Arize's guide, has a narrower attribution layer than LangSmith Engine or Galileo; and the OpenInference standard, built on OpenTelemetry with spans exported via OTLP, captures LLM-specific events across more than 40 framework integrations MLflow.
Sources
- Top 5 LLM and Agent Observability Tools in 2026 | MLflow
- Top Open Source LLM Observability Tools in 2026: Compared
- [2607.18754] AgentDebugX: An Open-Source Toolkit for Failure Observability, Attribution, and Recovery in LLM Agents
- AgentDebugX: An Open-Source Toolkit for Failure Observability, Attribution, and Recovery in LLM Agents