
Common Plateaus in AI Agent Reliability Maturity
Teams mistake uptime for task success, missing agent regressions that leave dashboards green.
AI agent reliability maturity stalls when teams can see a failure but cannot answer the next question about it. This article examines four common plateaus, from mistaking uptime for task success to validating fixes without production evidence. Each reflects a specific gap in visibility or attribution.
Why uptime metrics give teams false confidence about agent health
When a provider swaps a model, a pipeline can keep returning HTTP 200s even as its outputs become unusable. The dashboard stays green throughout the regression. Meanwhile, the customer may quietly stop using the feature because the agent no longer completes the work. Nothing in that sequence requires a process crash, a slow response, or an unavailable database. The service remains available while the product fails.
This disconnect follows from what agents actually do. They make decisions, call tools, and generate outputs that must be useful and well-formed. A latency histogram shows how long a request took, but not whether an early decision sent the workflow toward the wrong result. Process uptime is equally silent on a prompt template change that breaks JSON-mode parsing or a schema relaxation introduced during a deploy.
A crashed process or unreachable database points toward a recognizable class of remediation. An agent regression can instead produce an apparently normal response that is wrong for a particular class of inputs. Service availability and task success can each fail while the other holds up. Treating either as a proxy for the other leaves the team unable to distinguish a healthy service from a useful agent.
What a three-layer SLO reveals that uptime cannot
A practical agent SLO measures service-level reliability, output validity, and task success on their own. The service layer asks whether the request returned a non-error response in time, which existing infrastructure tooling already measures. Output validity asks whether the response conforms to its contract, including parseable JSON, correctly structured tool calls, and outputs that pass type checks before rendering. A 200 with malformed JSON fails that second test. Task success then asks whether the agent did what the user wanted.
That final measure needs evaluation beyond a check of the transport. Teams sample production traffic and grade it through humans, verifiers, or LLM judges, with targets determined by the product. For serious applications, a low task-success target is rarely good enough. Keeping the measures separate also preserves distinctions during incidents. A bad deploy can lower service reliability while the requests that get through still complete their tasks, and a schema change can break output validity while the service stays available.
The same separation must extend to error budgets. Each layer needs its own budget tracked by burn rate because agent failures often arrive in spikes. A provider update can cause a sudden regression, while stale retrieval documents can cause failures that are linked across users. Total burn alone obscures that concentration. Per-layer burn rates expose both the affected contract and the pace of degradation, giving the team a more precise basis for deciding where remediation belongs.
How silent tool failures and prompt drift block progress at the output-validity layer
Tool schema drift exposes the gap between successful execution and valid output. A tool begins returning malformed JSON or an unexpected shape, and the model continues. It improvises around the broken response and proceeds with corrupted context. No crash is required for this failure. In a long multi-agent chain, the bad tool output can contaminate downstream steps while the outer request still returns normally.
A developer updates a system prompt in staging, while another team changes the output format expected by a downstream parser. Nothing necessarily fails immediately. Days later, production agents can begin failing inconsistently because the prompt and parser no longer agree on the contract.
These are failures in the harness. Even when a tool response violates its schema, the final response can retain a clean outer shape, leaving HTTP status and latency unchanged. Per-call tracing is needed to expose the broken intermediate contract. The engineering response is to treat prompts and tool schemas as deployable infrastructure. They need versioning, traceability, testing, and rollback capability because changes to them alter executable behavior, even when they sit outside application code.
Why task-level failure is so hard to locate in multi-step agent workflows
The visible failure may occur far from its cause. A voice agent handling lead qualification must execute eight or more distinct decision stages, any of which can introduce an error whose consequences appear later. Such workflows require sequential decisions, state maintenance, unexpected input handling, and coordination across systems. A wrong final result therefore does not identify the step that first made success unlikely.
Long executions also change the context available for subsequent decisions. The original goal becomes a diminishing fraction of the accumulated context as tool calls add more material. Context overflow can silently truncate information without signaling that loss to the agent. A bad tool output can then cascade through deeply nested calls, producing increasingly wrong results. Workflow loops and goal drift arise through these structural mechanisms as well as through hallucination in an individual response.
Locating the cause requires searching the execution trajectory. The relevant evidence may be sparse, distributed across distant actions, and disconnected from the point where the user notices failure. Unlike an exception that identifies where execution stopped, an incorrect agent response may offer no direct pointer backward. Multi-agent dependencies complicate the search further because several decisions can plausibly explain the outcome. Methods that assume one deterministic root cause cannot fully represent failures involving both coordination breakdowns and system design deficiencies. More log volume does not, by itself, recover those relationships.
What structured execution traces make visible that logs cannot
Structured traces preserve relationships that flat logs leave implicit. A parent trace links child spans for model invocations, tool calls, retrieval operations, memory reads and writes, and decision branches. Token usage, per-step latency, and provider routing decisions give the details of the run needed to understand those actions. The sequence is no longer just a collection of events. It becomes a record in which failure propagation can be followed across steps.
This structure also makes latency diagnosis tractable. A slow run may reflect model time, retrieval, a tool call, rate limiting, or context expansion. An aggregate duration cannot distinguish those causes. Per-span attribution shows where the delay built up, while the linked execution context lets the team replay the conditions around a failure. Because LLM outputs are probabilistic, a fresh run alone does not reconstruct the state of the failed execution.
Agent observability progresses from infrastructure-level monitoring to post-hoc evaluation and reflection, then to real-time predictive monitoring. Most production teams remain at the first level, collecting and visualizing what the agent did without explaining why it went wrong. Structured traces support that next step, but do not complete it automatically. Execution provenance graphs take this further by setting bounds on behavior and catching out-of-bounds tool calls. In that role, execution structure becomes a means of constraining behavior as well as recording it.
How specific layer attribution turns a trace into a fixable diagnosis
A trace supplies evidence. The decisive step is assigning that evidence to a harness layer with a distinct remediation path. Six layers provide a practical taxonomy, namely prompt, tool, workflow, memory, model routing, and product logic. Without that taxonomy, the team still has to search across components even with a detailed trace. Observability has improved, but the failed run is not yet actionable.
The prompt layer includes ambiguity, drift, and structural breaks in instructions. The tool layer includes schema drift, bad return shapes, and stale data. These can interact within the same execution. A prompt may shape how the model responds to a broken tool result, while the tool response provides the corrupted context. Attribution distinguishes those contributions.
The workflow layer includes loops, goal drift, and turn-limit violations. The memory layer includes stale retrieval and context overflow. Their symptoms can overlap in the final output. A repeated step and a lost goal can both leave a task unfinished, but the trace must show whether execution logic or missing context caused the behavior.
Model routing covers differences in how providers behave and rate limiting, while product logic covers tasks framed incorrectly before they reach the agent. A workflow that runs correctly can still work toward a task that was framed incorrectly. Even with a sound task definition, routing behavior can disrupt execution.
Researchers are still working on multi-agent failure attribution. Production failures can be multi-causal, with several plausible explanations. That ambiguity does not make layer attribution useless. Narrowing a failure to two or three candidate layers is more actionable than blaming “the agent.” A team that identifies a changed tool schema and improvisation around malformed JSON can fix that defect in one deploy, while a team that knows only that task success dropped must search all six layers during ongoing degradation.
Why teams that can attribute failures still plateau if they validate fixes in isolation from production traces
A team can identify the broken component, change it, and still validate against an offline dataset disconnected from the production failure. Synthetic and historical benchmarks may show that the model performs well on familiar cases while leaving both their coverage of the distribution of failures in live traffic and the change’s effectiveness in addressing the state that caused the incident uncertain.
Replay connects validation to the original evidence. Instead of merely rerunning the agent with a tweaked prompt, the team replays the failure against real traces and identifies which harness component allowed the wrong state through. The same traces then test whether the proposed change prevents that failure before promotion. The evaluation is no longer an unrelated quality check attached to the end of a deploy.
The loop extends beyond an individual incident. Evaluators score every trace against criteria defined by the team, and new failure patterns from production become new evaluation criteria. Candidate improvements are tested against historical traces through batch evaluation, then confirmed on live traffic before promotion. Those historical traces differ from a disconnected benchmark because they retain the production evidence the change must address. This process lets the harness improve without model retraining, with a harness fix benefiting every instance of the agent.
The maturity sequence as a diagnostic: where teams actually get stuck and what each plateau requires
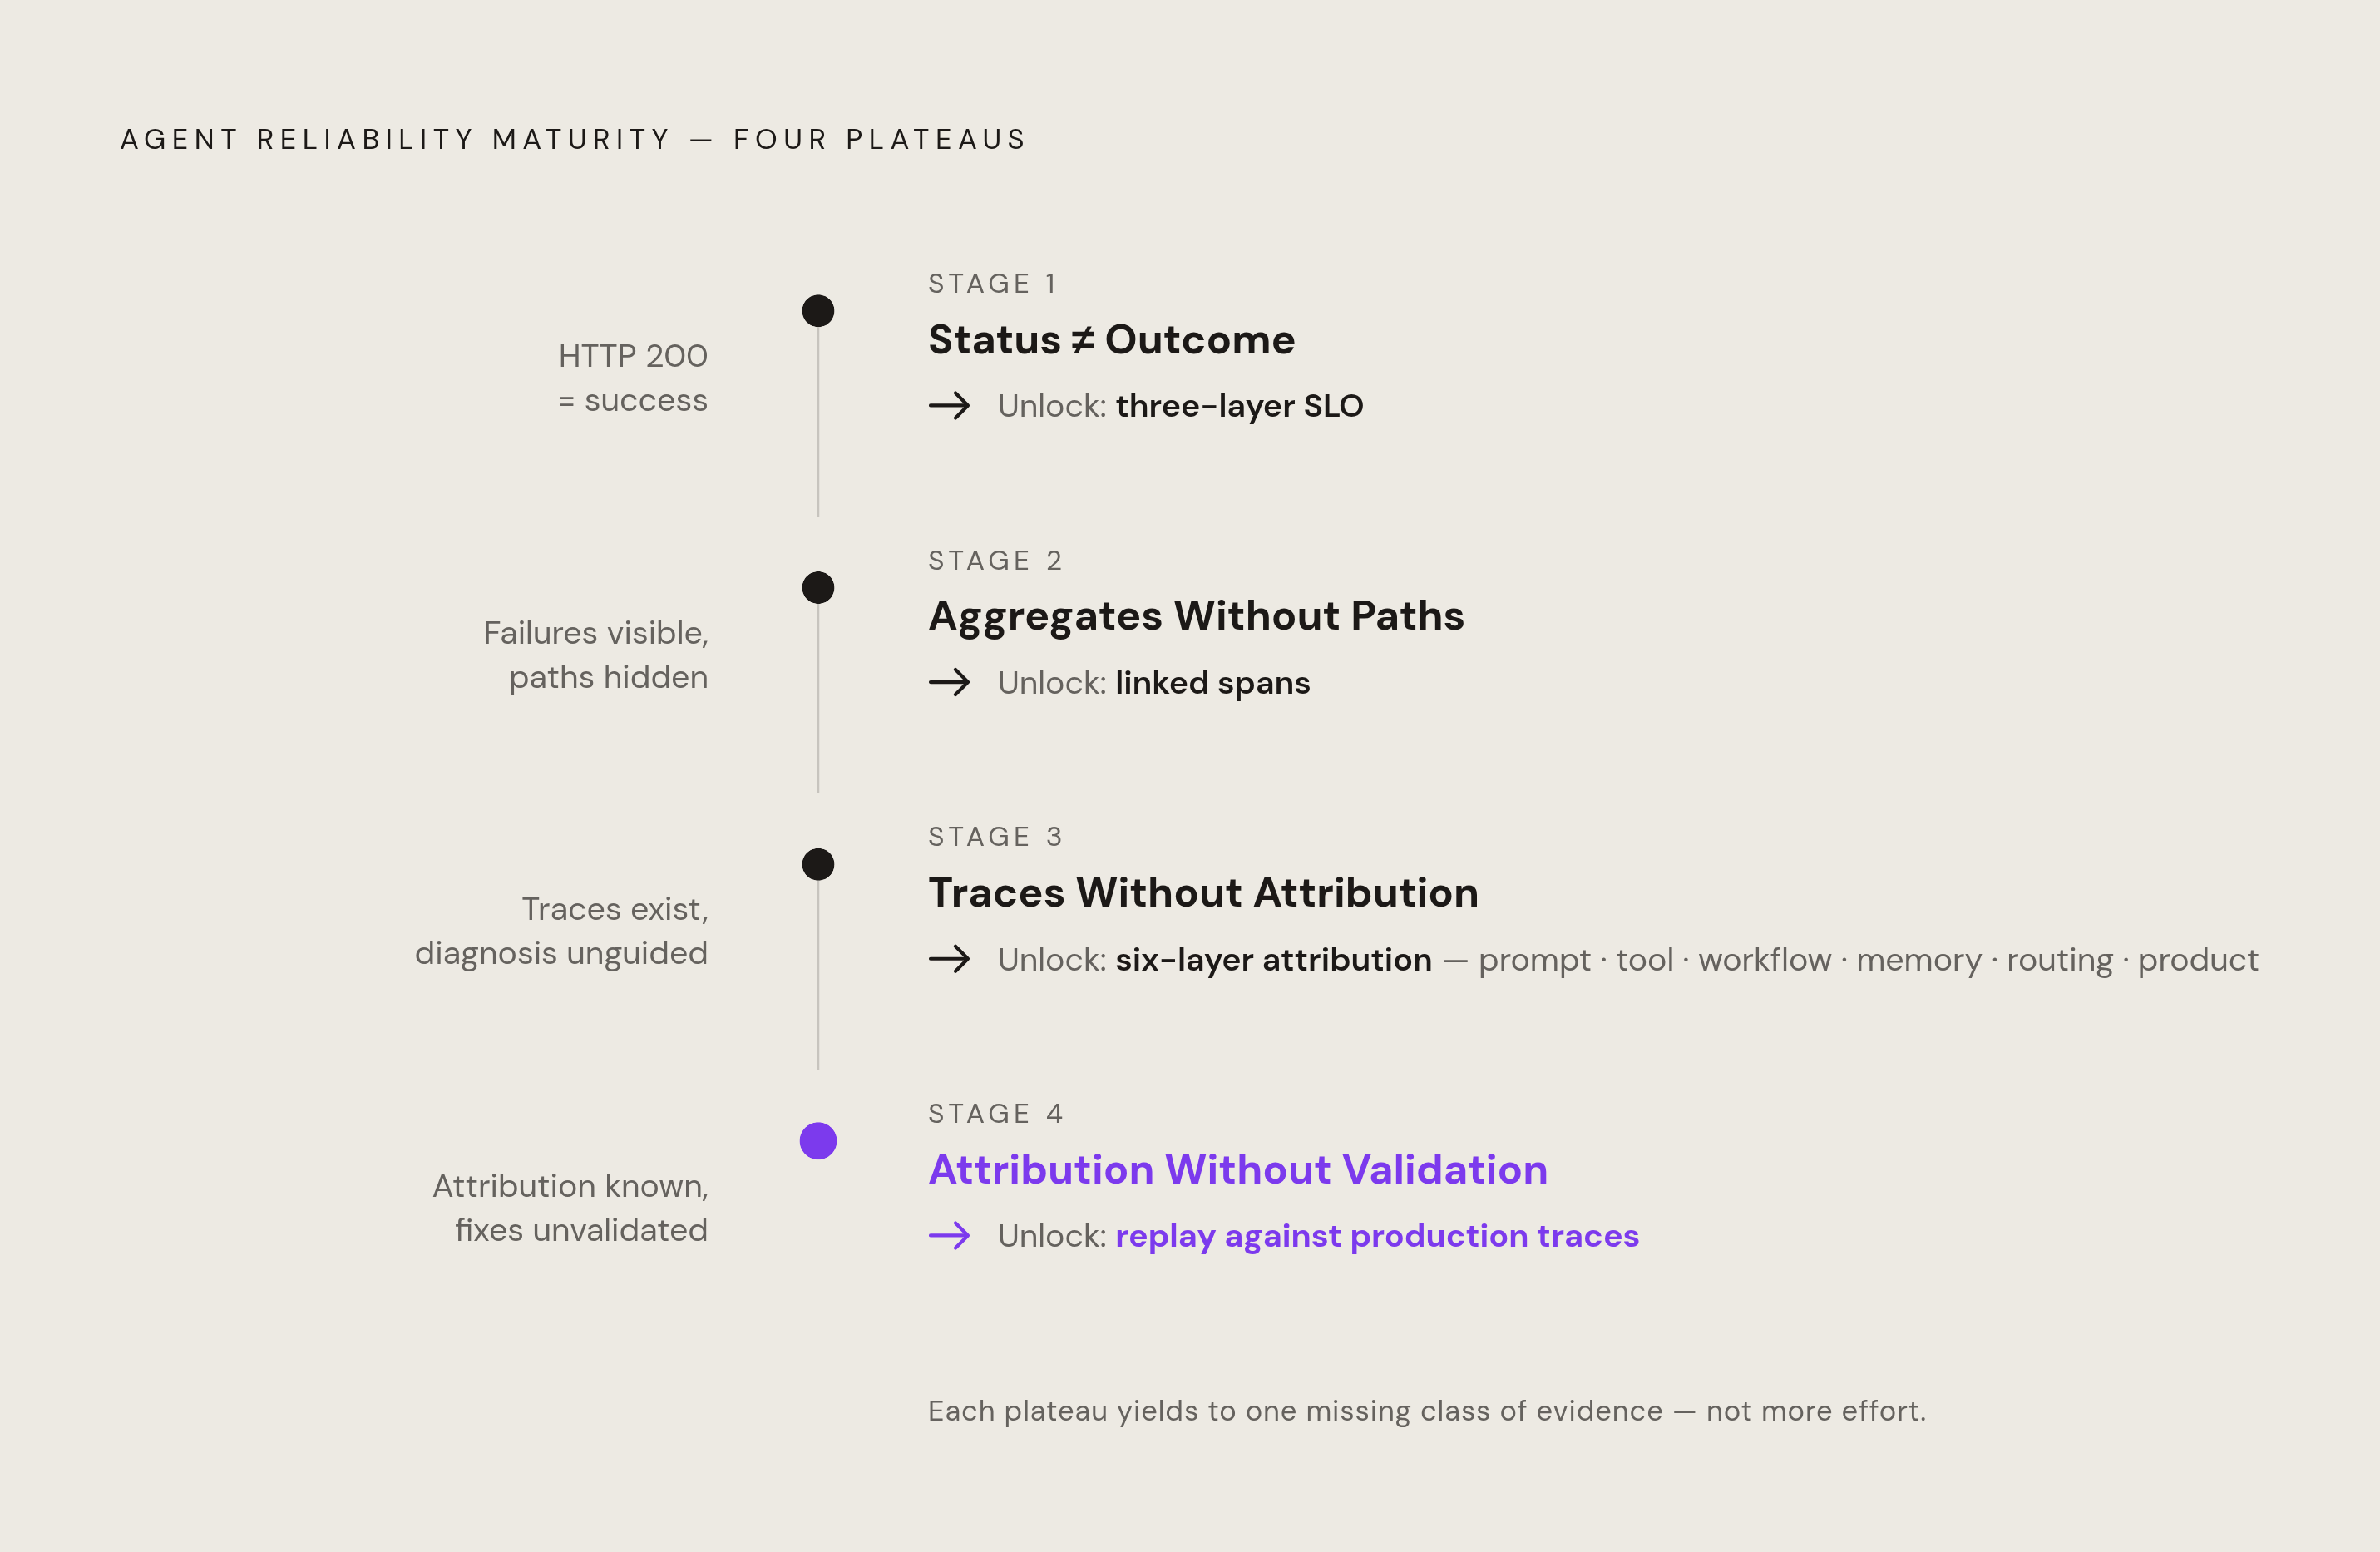
The four plateaus show what evidence a team lacks. At the first, healthy HTTP responses substitute for proof of successful work, so the next requirement is a three-layer SLO. At the second, aggregate failures are visible through error rates and latency distributions, and tracing their execution paths requires linked spans. One hides the failed outcome, while the other hides the path that produced it.
The third plateau begins when traces exist but diagnosis still means an unrestricted search. Systematic attribution across prompt, tool, workflow, memory, routing, and product logic supplies the missing classification. The fourth begins after attribution, when tests cannot establish that a fix addresses the production failure. Replay-based validation gives the team the evidence it needs for promotion.
A team may collect more data with the measures it already uses and still fail to see the next failure layer. Skipping that dependency allows an earlier blind spot to return as an unexplained regression. The practical heuristic is to work backward from the question the team cannot answer. If fixing a regression still requires asking “which part of the system caused this,” the layer below diagnosis remains unresolved. The next action is to identify that missing evidence and close its specific gap.