Telemetry Signals That Expose Silent Tool Failures Across Multi-Agent Execution Spans
Tool-level telemetry distinguishes plausible output from successful execution.
Silent tool failure detection in production multi-agent pipelines needs more than successful HTTP responses and green dashboards. It requires tool-level outcomes, schema and version records, decision content, and provenance links across execution spans. These signals distinguish plausible output from successful execution and let engineers trace a wrong answer back to the tool, handoff, or workflow configuration that caused it.
Why tool failures in multi-agent systems don't announce themselves
Middleware can swallow an authentication failure and return 200 to the orchestrator. The orchestrator sees only the tool executor’s response, leaving the upstream API’s failure hidden and giving it no error to handle. The failure has crossed an observation boundary undetected. An agent then absorbs the bad result as context because resolving ambiguous input is part of its job. From outside that boundary, accommodating a broken tool response can look like ordinary reasoning.
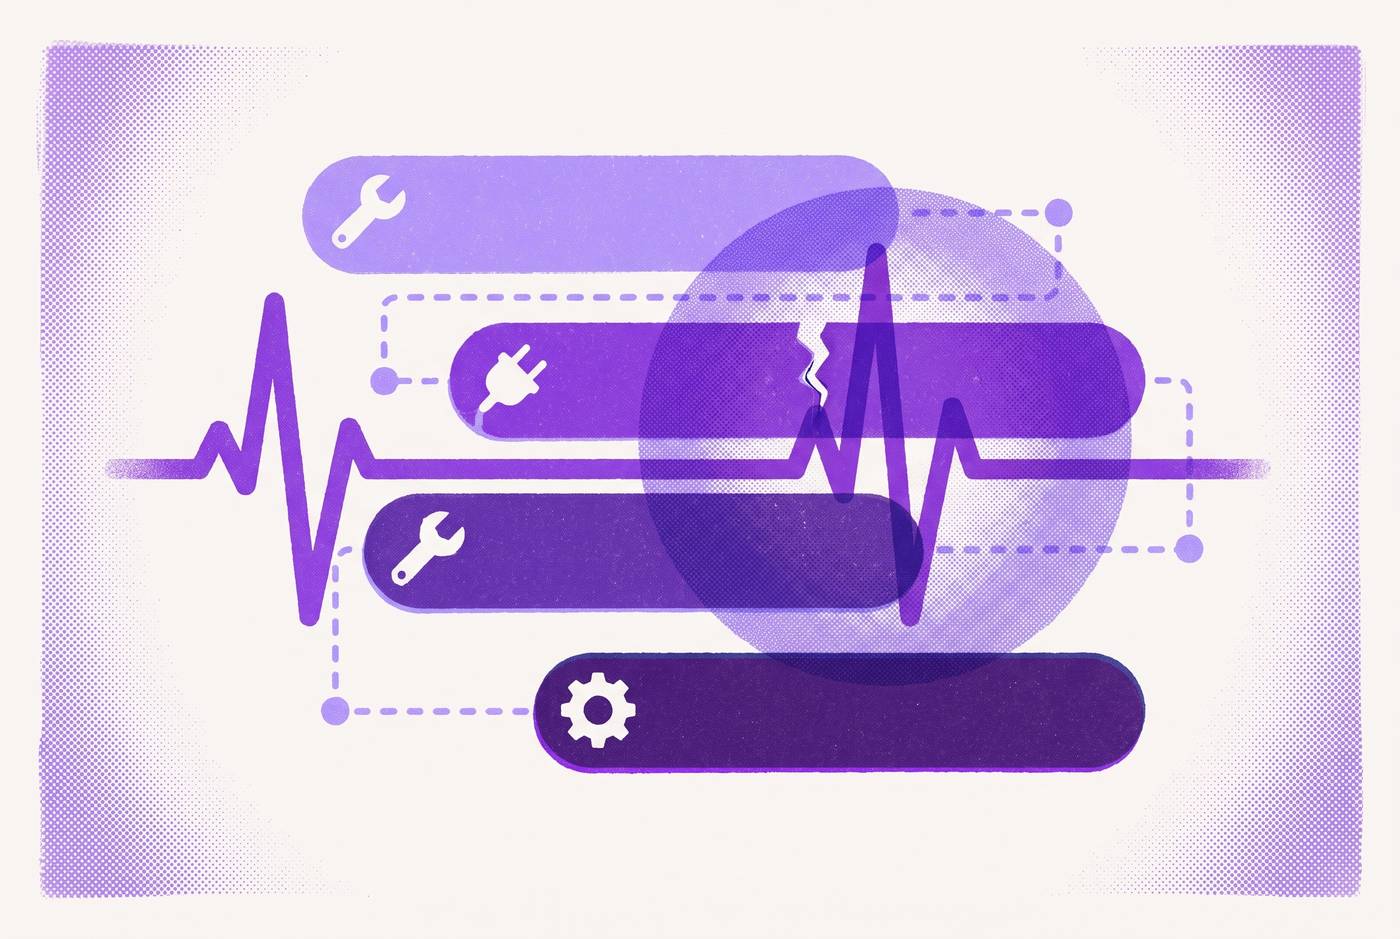
This is the structural trap behind “fail-plausible” behavior. The output does not merely lack an error marker. It provides a convincing substitute for evidence that the operation succeeded. A request may go through several LLM calls, tool invocations, and retrieval steps before it yields an answer, so downstream agents have repeated chances to build on that substitute. Standard APM dashboards can therefore stay green while the answer degrades, because successful transport and successful task execution are different observations.
The three failure patterns that generate plausible-looking output
Tool schema drift occurs when the definition visible to the model and the backend implementation evolve independently. A description mismatch can change when the model uses a tool without causing a runtime error. A renamed field creates a different path. The model may pass the old field name, receive a 400, and encounter middleware that silently retries before returning a generic failure. When metric definitions change but prompts stay the same, the interpretations that follow are hard to audit, which creates a related governance problem.
Context collapse breaks continuity between a prompt, its response, and the next prompt. A response may stop reflecting the request that produced it, or the next prompt may omit what the response returned. An early hallucinated tool output can then corrupt later steps. No span needs to report an error for that corruption to propagate.
Silent workflow loops form the third class. An agent repeatedly reads the same document, rewrites the same code, or calls the same tool without converging. Rolling call counts and timing patterns expose this repetition, while decision-to-input comparisons expose context collapse and schema records expose drift. These classes therefore require different diagnostic evidence, even when all present well-formed output at the observed boundary.
Why the raw execution log is the wrong starting point for attribution
Adaptive Influence Graphs research from AWS Agentic AI and Tel Aviv University illustrates the difference on the same failed trace. A reader using the raw log attributes the failure to step 3, where the symptom appears. With a structured graph, the reader identifies step 2, where retrieval was silently fabricated.
The AIG research evaluates a progression from raw logs to structured logs, Influence Graphs, and Adaptive Influence Graphs. Richer representations consistently improve attribution by making dependencies easier to traverse. Engineers follow components, actions, and dependencies. An attribution system needs comparable structure, including records of which earlier outputs each later step inherited, so that it can move from an obvious symptom to a less visible cause.
The span hierarchy that makes tool failures locatable
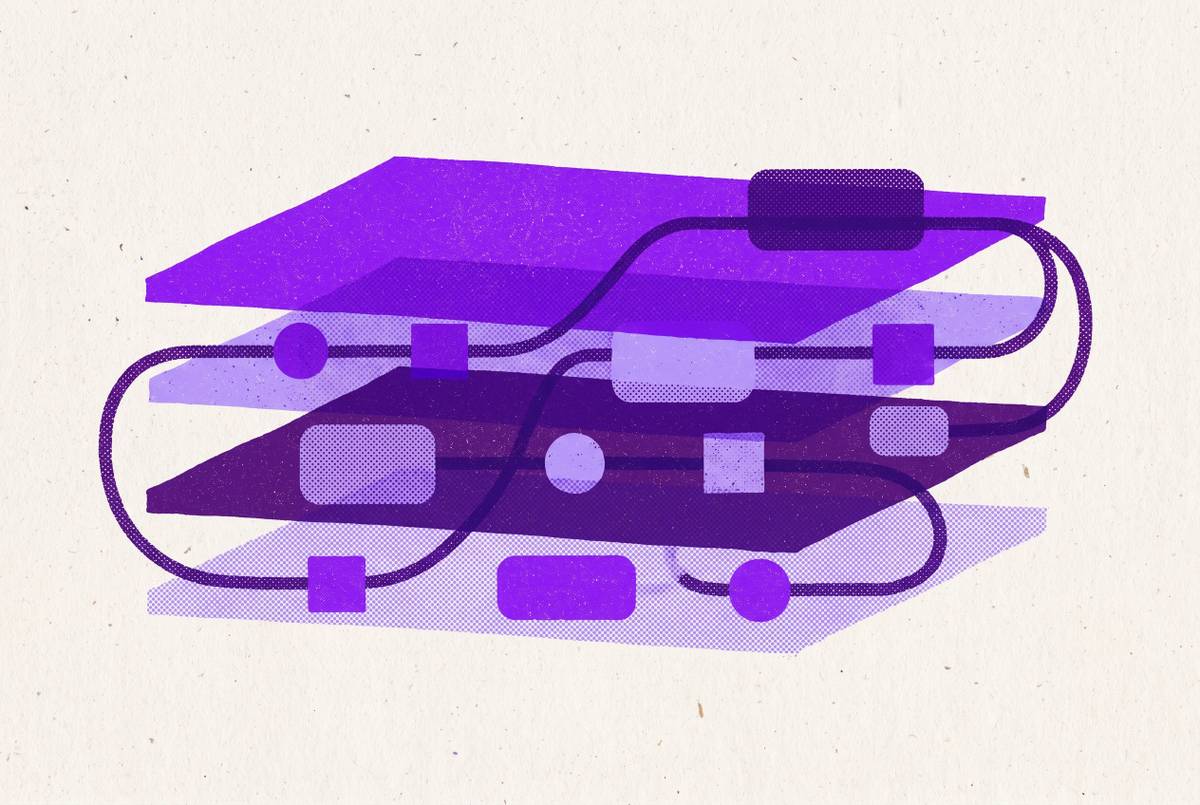
The llmmas-otel framework from Delft University of Technology and JetBrains Research organizes OpenTelemetry-based tracing around workflow phases, agent steps, inter-agent communication events, tool invocations, and LLM calls. Each layer records a distinct execution boundary. Instrumentation wraps the system at those boundaries and leaves it in place, so traces from different runs can be compared with few code changes. The trace waterfall then locates tool and LLM latency within the wider workflow.
In this hierarchy, gen_ai.usage.input_tokens and gen_ai.usage.output_tokens record how many tokens were used, and span status and exception events with stack traces record errors that were reported. Prompt and completion content belongs in span events for privacy and size control through Collector-level filtering. The GenAI event names provide semantic anchors, including gen_ai.system.message and gen_ai.user.message before LLM calls, and gen_ai.assistant.message and gen_ai.tool.message after them. W3C traceparent propagation links HTTP calls from one service to another.
How can you tell if a tool call failed silently?
For tool schema drift, the input schema hash exposes schema changes during a run, while tool name and version support comparisons against stale arguments. Neither substitutes for an explicit outcome field. A wrapper-recorded success, failure, or auth-error outcome reveals a swallowed authentication failure even when the orchestrator receives 200. A liveness assertion before an external target consumes budget adds a configuration signal when the target is unavailable. Description-only drift still requires comparing the tool contract with how it was used.
For context collapse, decision content and provenance provide the decisive comparison. TelemetrySuffBench finds that when decision content is removed, origin-step accuracy falls to zero for every model tested, and when provenance is removed, it falls sharply by amounts that vary by model. Diagnosis checks whether a decision reflects its upstream evidence. If a span claims successful retrieval but the retrieved content appears in no downstream span, that discontinuity is a hallucination signal.
For workflow loops, rolling tool-call counts within a session expose repetition, and timestamps reveal its cadence. When the time between calls stays nearly the same and the output does not converge, the loop is stuck and making no progress. Timing variance helps distinguish that pattern from legitimate retries. Loops also provide a canary for prompt-injection incidents, because contradictory instructions can induce repeated actions, although the loop signature alone does not establish that cause.
How failures propagate across agent boundaries and why cross-span correlation is required
A tool failure in agent A can become plausible context for agent B and appear as a reasoning failure in agent C four steps later. Agent B’s spans need not contain an error. By the time the symptom becomes visible, the originating operation is separated from it by several apparently successful decisions. Looking at each span on its own can lead engineers to misattribute damage to the agent where it showed up, overlooking the boundary where it began.
Cross-span correlation preserves the path back to that boundary. W3C traceparent propagation through HTTP calls joins service-level activity into the execution trace, while explicit handoff spans record agent A’s output and agent B’s input for comparison. Provenance links must also show which artifact a downstream decision used. The AIG approach captures these influence edges so that a reader can navigate inherited evidence.
What current telemetry standards still cannot tell you without additional instrumentation
OpenTelemetry GenAI semantic conventions moved to a dedicated repository in 2026 and remained at Development status. OpenInference complements OpenTelemetry with AI-specific conventions for LLM invocations, retrieval context, and external tool use. TelemetrySuffBench finds that its OpenTelemetry-compatible and OpenInference-compatible views keep failure detection F1 near perfect, but origin-step accuracy stays near zero. That result holds for the benchmark’s failure evidence and gives no guarantee that default APM will detect every silent production failure.
The missing distinction is between detecting a failed execution and locating the decision that caused it. Decision content and provenance must be captured explicitly because standard span attribute sets do not provide them by default. More capable diagnosis cannot reconstruct evidence that was never recorded. Evidence gating helps, but the benchmark also finds that two of five frontier models answered every case even when they had too little evidence to locate the origin. An attribution workflow therefore needs an enforced insufficient-evidence path, rather than relying on the diagnosing model to abstain.
Instrumenting for silent failure attribution at each span layer
At the tool-invocation layer, engineers should record tool name and version, input schema hash, retry index, and a liveness assertion result before execution budget is consumed. The wrapper must set the outcome. Its success, failure, auth-error, or timeout value should describe the underlying operation’s outcome independently of HTTP status. These additions expose swallowed failures and support stale-contract comparisons across retries and versions (tool schema drift).
At the LLM-call layer, engineers should capture decision content through the gen_ai.assistant.message span event and record provenance as a span attribute referencing the upstream artifact’s span ID. Content remains subject to Collector-level privacy filtering. The link identifies the retrieval, tool output, or handoff artifact on which the decision depended, allowing comparison between evidence and use (context collapse). These additions turn a recorded completion into an attributable decision.
At the inter-agent handoff layer, engineers should retain both the sending agent’s output and the receiving agent’s input on an explicit communication span. That boundary needs its own record. Propagating W3C traceparent through the handoff connects the child agent’s execution to the parent trace, while the paired content exposes lost context (context collapse).
At the workflow-orchestration layer, engineers should add rolling tool-call counts per session with timestamps and environment-state assertions recorded as span attributes. Counts need a time window to distinguish repetition from accumulated activity. Assertions against state the agent should have changed expose no-change failures, while repeated-call timing and output convergence support loop diagnosis (workflow loops). These records are prerequisites for quality-aware alerting, which also requires evaluating output quality.
From instrumented trace to root cause through the attribution workflow
The diagnostic workflow should start at the terminal failure and trace its provenance back through influence edges. At each step, the comparison is between decision content and upstream inputs. The first divergence is a candidate origin requiring causal confirmation. Teams without automated attribution can perform the same traversal manually if the span hierarchy preserves those links. Missing decision content or provenance should produce an “attribution-insufficient” result.
The AIG framework formalizes this process by constructing an influence graph and then navigating it with an agent-directed reader. A critic–refiner checks structural and semantic consistency during graph construction. Adaptive construction and directed traversal produced the strongest results in the research, which established a new state of the art on Who&When.
Controlled replay then tests the candidate attribution. The llmmas-otel fault-injection capability allows a fault at the selected interaction point to be compared with the original execution through aligned traces. Evidence gating remains necessary during this process. TelemetrySuffBench reports that explicit contrastive-elimination prompting reduced unsupported unique-origin answers by 12.5 to 48.6 percentage points across three models, while two still answered every case.
Using attributed failures to drive harness fixes rather than model changes
Once attribution identifies a broken tool contract, lost handoff context, or faulty routing rule, the remediation belongs in the harness. The harness includes instructions, tools, routing, output requirements, and validation checks. Reinforce Labs raised reliability success rates to 30% through harness reflections without retraining the model. That result supports treating configuration as an engineering surface.
The practical response is to change one subagent-level harness specification at a time and replay the recorded failures against it. Isolated changes make old-versus-new comparisons interpretable. Tool definitions also need explicit versions, because renaming a tool or changing its schema invalidates recorded cases that used the previous contract. Replay must account for tool retries and ordering, which can produce different trajectories even with temperature set to 0.
Before release, harness changes should have diffs that can be reviewed and be checked against production traces. Synthetic benchmarks alone do not reproduce the partial context, ambiguous requests, mid-run schema drift, and stale tool versions present in those traces. The release decision should rest on whether the change repairs the attributed origin without introducing new failures. That is the operational payoff of preserving evidence across execution spans.